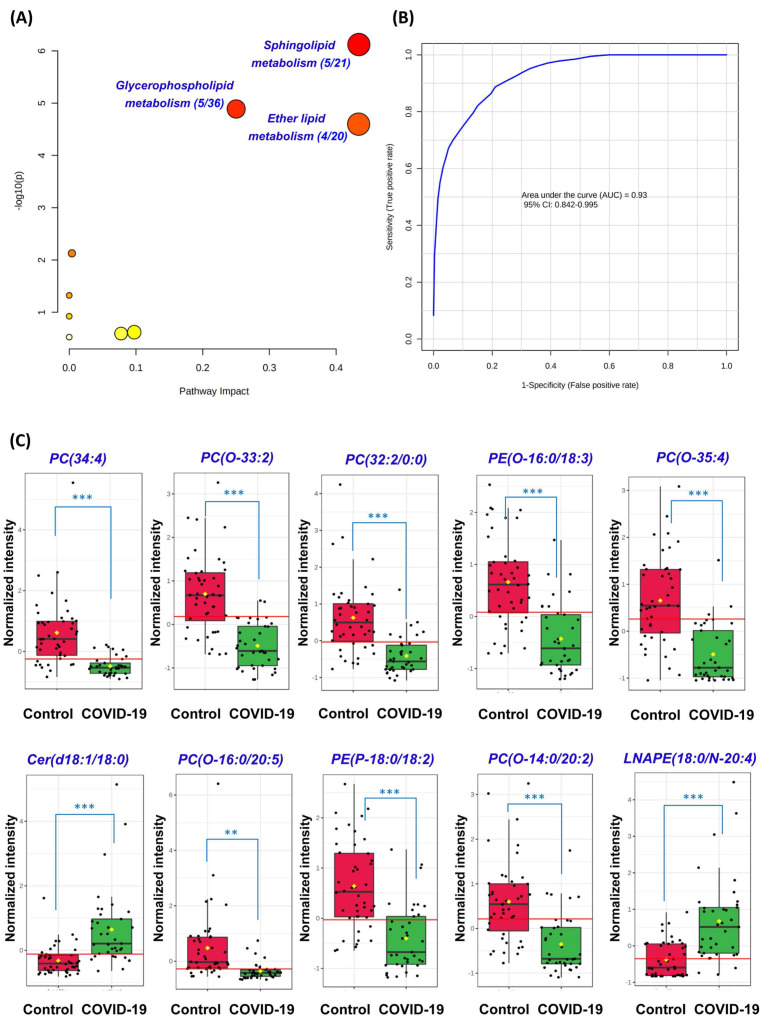
Figure 3.
Perturbed pathway and receiver operating characteristic (ROC) curve analyses. (A) Pathway analysis of the lipidomic changes in COVID-19 patients' plasma samples using MetaboAnalyst. The x-axis represents the value calculated from the pathway topology analysis. The y-axis represents the transformation of the original p-value calculated from the enrichment analysis. (B) Ten lipids were selected by area under receiver operating characteristic (AUROC) >0.8. The figure was generated using MetaboAnalyst with ten lipids combination model. Feature ranking method was chosen as univariate AUROC. (C) Boxplots showing the different normalized intensitieis of the ten lipids between the COVID-19 patients' and non-infected control subjects' plasma samples. The horizontal red lines indicate the optimized cutoff values. The yellow diamonds and black hortizontal lines indicate the mean and median concentrations of each group, respectively. The “O-” prefix indicates the presence of an alkyl ether substituent, e.g., PC (O-16:0/20:5) and the “P-” prefix indicates the 1Z-alkenyl ether (Plasmalogen) substituent, e.g., PE (P-18:0/18:2). **, P<0.01; ***, P<0.001 (Student's t-test).

