FIGURE 3.

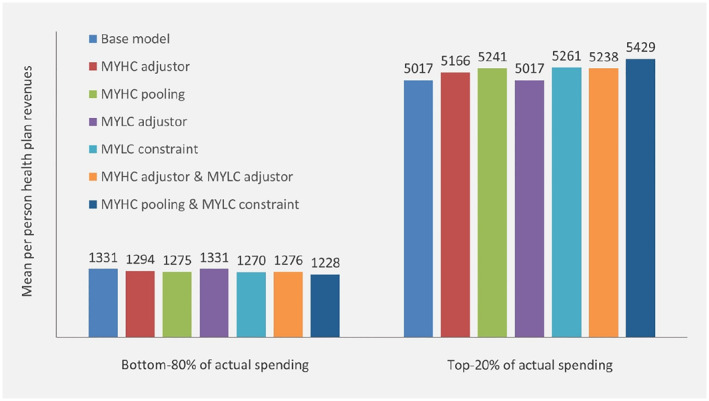
Mean per person health plan revenues from seven alternative payment systems for people in the bottom‐80% and those in the top‐20% of actual spending respectively. Outcomes are based on total population (N = 16.7 m). Revenues in Euros

Mean per person health plan revenues from seven alternative payment systems for people in the bottom‐80% and those in the top‐20% of actual spending respectively. Outcomes are based on total population (N = 16.7 m). Revenues in Euros