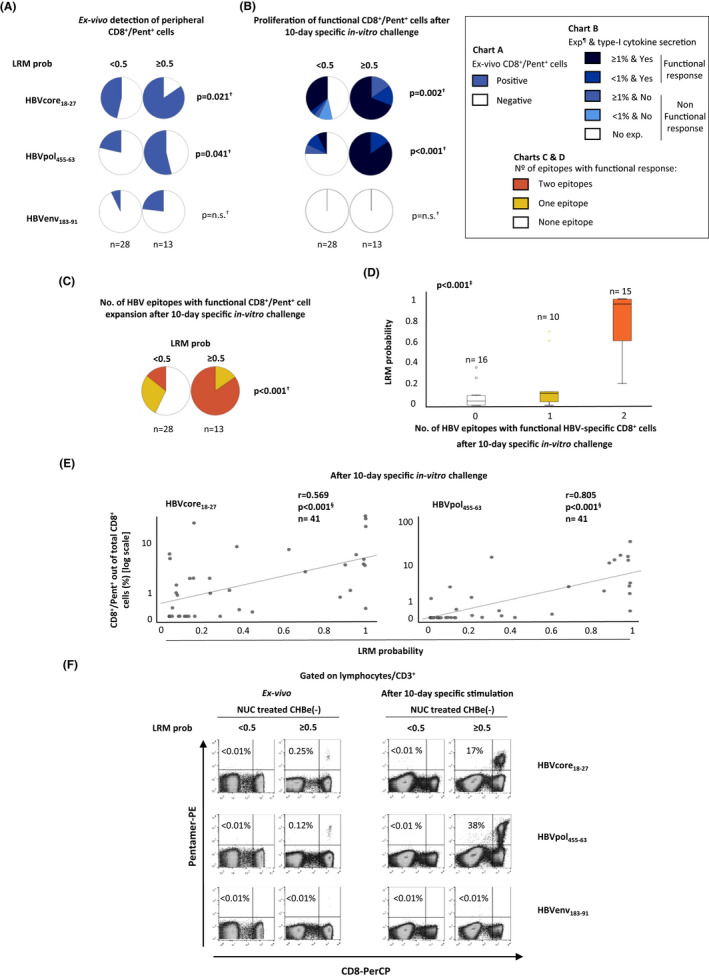
FIGURE 3.

Peripheral ex vivo detectability and expansion ability of functional HBV‐specific CD8+ cells after specific in vitro challenge according to the model probability of having a functional response against core and pol epitopes. Pie charts depicting the percentage of cases with (A) peripheral HBV‐specific CD8+ cells detectable ex vivo and (B) with proliferating type I cytokine‐secreting CD8+ cells after Ag encounter in eAg(−) chronic hepatitis B (CHBe(−)), according to the model probability of detecting a functional response against core and pol epitopes (≤0.5 vs >0.5). (C) Pie charts showing the percentage of cases with functional response against none, one or two HBV epitopes as a function of the model probability of detecting a functional response. (D) Boxplot chart showing the linear trend between the number of HBV epitopes with proliferating type I cytokine‐secreting CD8+ cell response in NUC‐treated CHBe(−) and the model probability. (E) Scatterplots depicting the correlation between the model probability of detecting a functional response and the intensity of HVB‐specific CD8+ cell proliferation after a 10‐day‐specific in vitro challenge. (F) Representative dot plots showing the CD8+/pentamer+ cells frequency out of total CD8+ cells directly ex vivo and after Ag‐specific expansion as a function of the model probability of detecting a functional response. CHB, chronic hepatitis B; env, envelope, e(−): e antigen‐negative; Exp, expansion; HBV, hepatitis B virus; n.s., non‐significant; LRM, logistic regression model; NUC, nucleos(t)ide analogue; Pent, pentamer; pol, polymerase; prob, probability. †Chi‐square test. ‡Jonckheere‐Terpstra test. §Spearman correlation test. ¶Expansion is given as the percentage of CD8+ Pentamer+ cells out of total CD8+ cells
