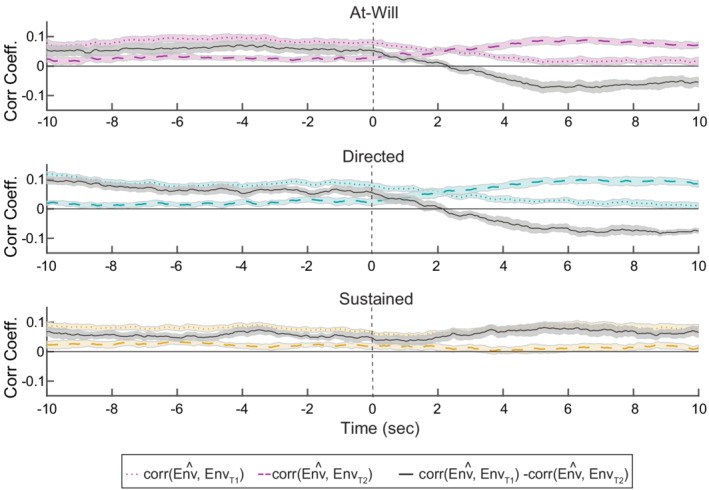
FIGURE 3.

Least‐squares decoding illustrates smooth switches in attention. In order to visualize the switch in talkers, the decoder output was correlated with the trial's initial attended and unattended talker speech envelopes. In the experimental conditions that contain a switch between talkers (top two panels), the correlation with the respective talker envelopes flip sign at a lag of approximately half the correlation window
