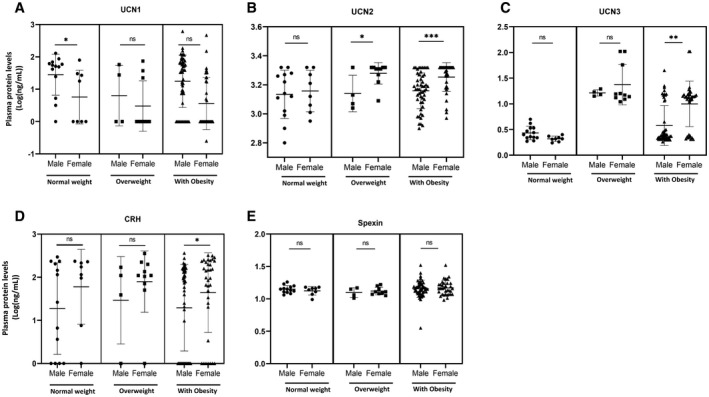
FIGURE 1.

Urocortin (UCN) and spexin levels in plasma based on body weight groups and sex. Circulating levels of (A) UCN1, (B) UCN2, (C) UCN3, (D) CRH, and (E) spexin were measured by ELISA using plasma samples from boys and girls in the normal weight group (n = 23 and n = 8, respectively), the overweight group (n = 4 and n = 10, respectively), and the obesity group (n = 50 and n = 35, respectively). A 1‐way ANOVA test was used to determine significance of the difference in means between the groups, and data were log transformed. Statistical significances are as follows: *p < 0.05, **p < 0.01, and ***p < 0.001. CRH, corticotropin‐releasing hormone; ns, not significant
