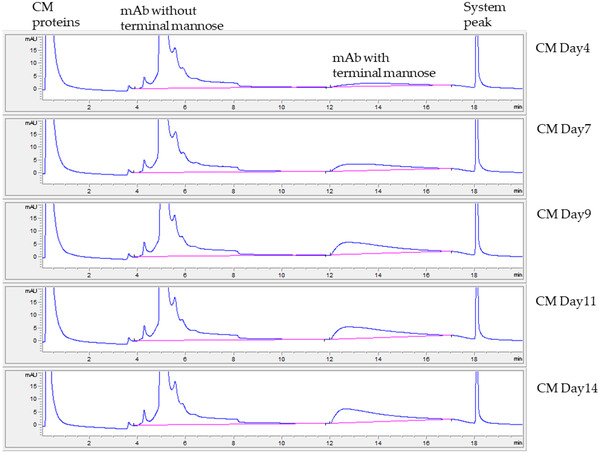
FIGURE 6.

Monitoring of terminal mannose in monoclonal antibody (mAb) cell‐culture medium (CM) collected on 5 different days by 2‐D protein A–concanavalin A (Con A) method on traditional HPLC. Peak integration lines are indicated in pink. Increases in terminal‐mannose peaks when cell culture progresses were visible and quantitated to predict the high‐mannose level of mAb in CM. mAb peak shapes were slightly different than those in Figure 3 due to the use of ProSwift Con A‐1S column with a higher system pressure limit, instead of the Con A‐4B column used in Figure 3
