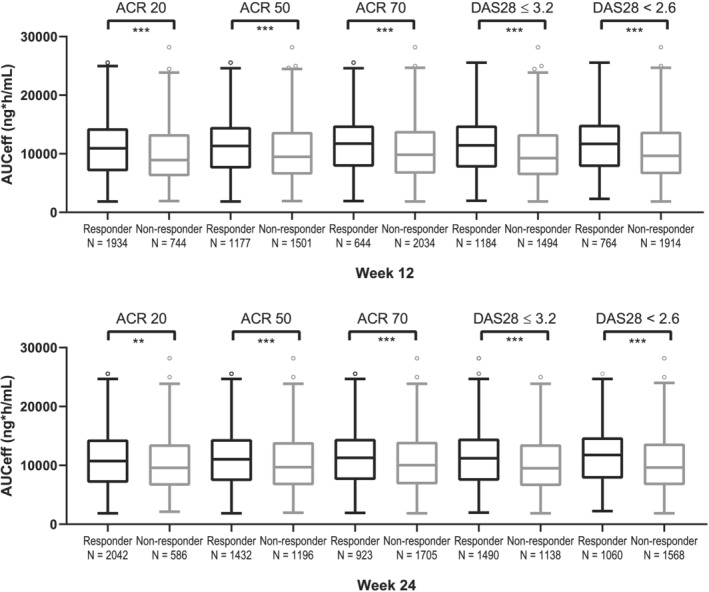
FIGURE 2.

Boxplot of AUCeff in subjects who achieved and did not achieve ACR20/50/70 and DAS28(CRP) responses in pooled phase 2 and phase 3 studies. The pharmacokinetic (PK)/pharmacodynamic analysis set includes subjects with rheumatoid arthritis who were enrolled/randomized, received at least one dose of filgotinib in studies FINCH 1, FINCH 2 and FINCH 3, and had at least one nonmissing PK parameter of interest. For each box, the bottom and top edges are located at the sample 25th (Q1) and 75th (Q3) percentiles, respectively, the centre horizontal line is drawn at the 50th percentile (median) and outliners (beyond 1.5 × the interquartile range) are displayed as small squares. ACR and DAS28 responses at week 12 are shown in the upper panel and ACR and DAS28 responses at week 24 are shown in the lower panel. **P < .01; ***P < .0001
