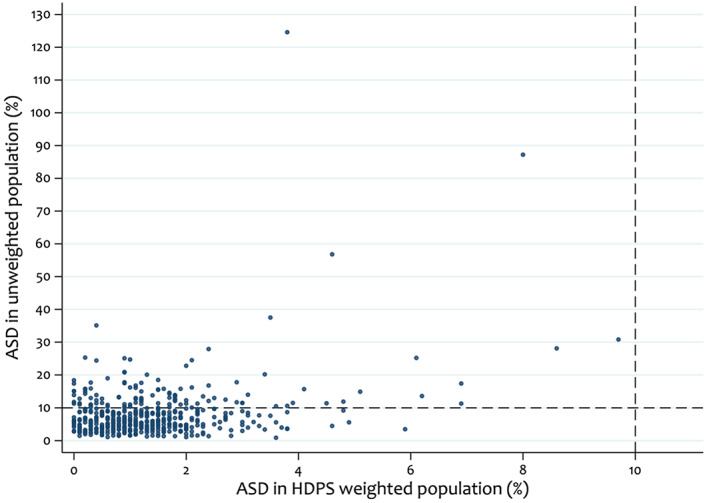
FIGURE 4.

Comparison of absolute standardised differences (ASDs) between unweighted and high‐dimensional propensity score (HDPS) weighted sample under the primary analysis, selecting the top 500 HDPS covariates. Dashed lines indicate absolute standardised differences of 10%
