FIGURE 6.

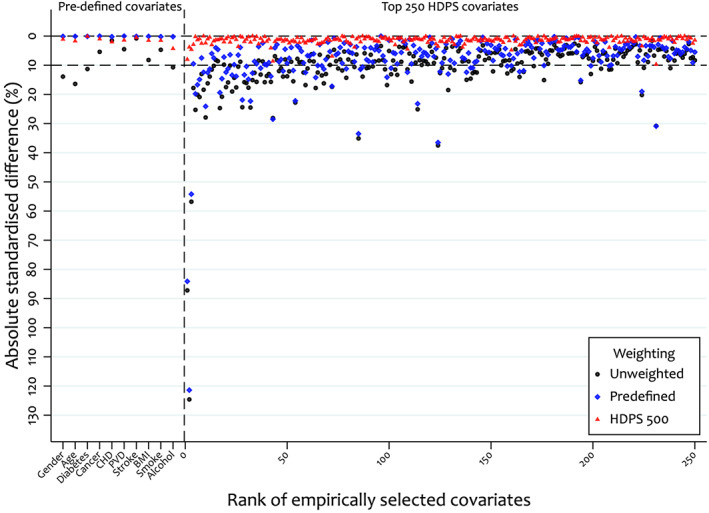
Comparison of absolute standardised differences in the pre‐defined and top 250 high‐dimensional propensity score covariates between unweighted, pre‐defined and HDPS (+500 covariates) weighted samples

Comparison of absolute standardised differences in the pre‐defined and top 250 high‐dimensional propensity score covariates between unweighted, pre‐defined and HDPS (+500 covariates) weighted samples