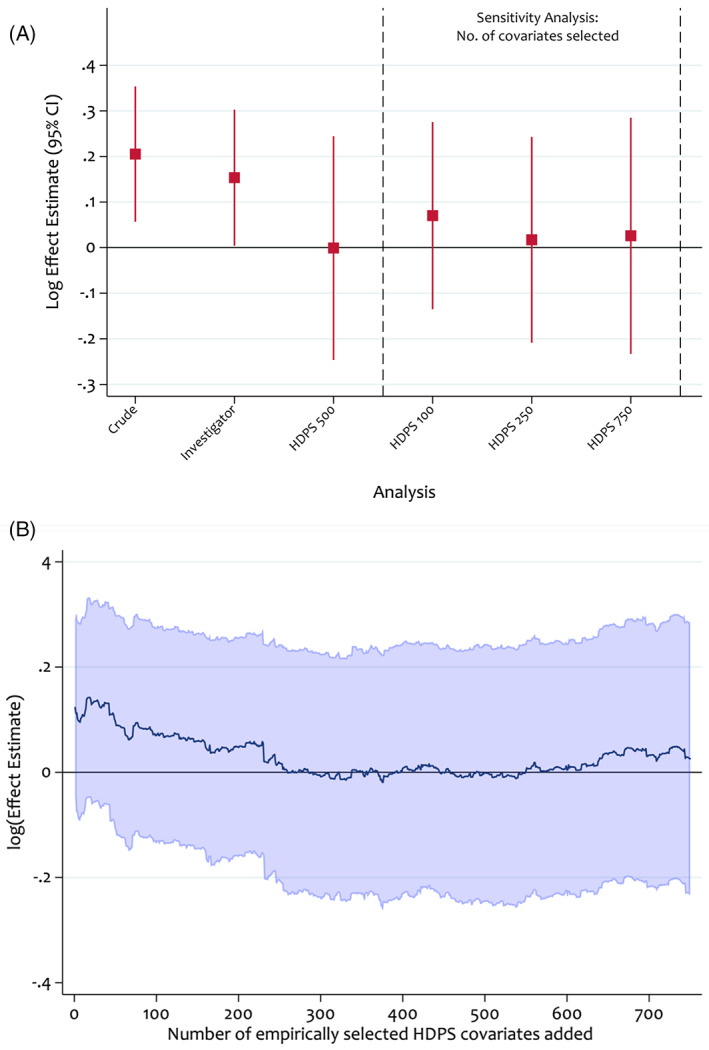
FIGURE 9.

Sensitivity analyses assessing the impact of the number of high‐dimensional propensity score covariates selected on the log effect estimate. Propensity scores were estimated using logistic regression and treatment effects were estimated using an inverse probability of treatment weighted Cox model
