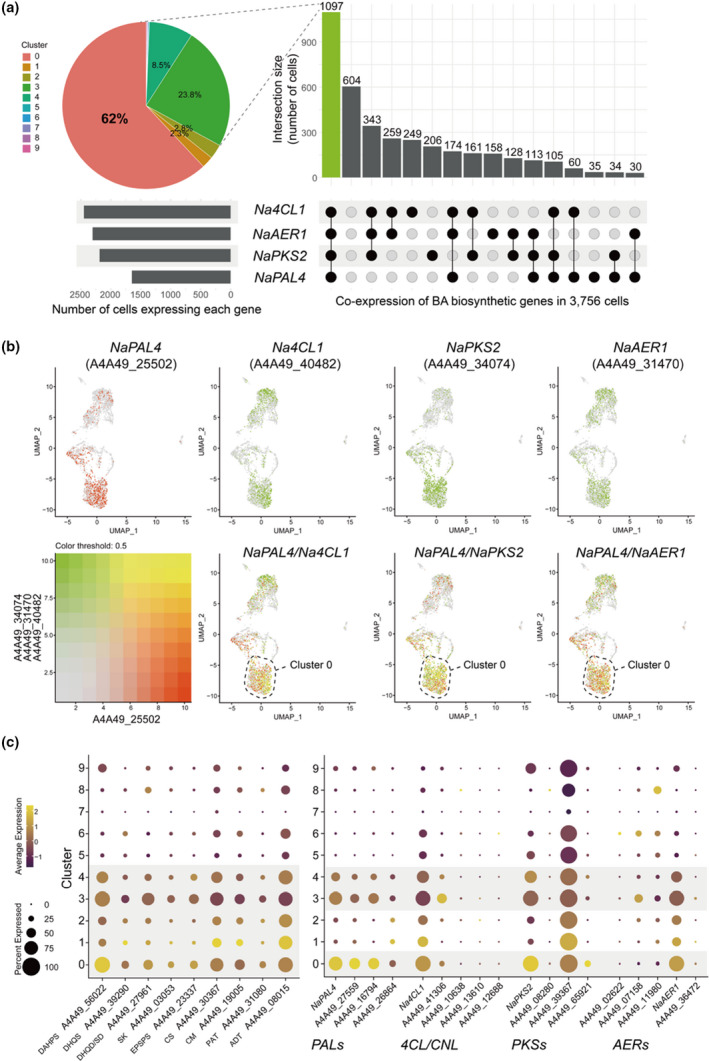
Fig. 6.

Characterization of benzylacetone (BA) biosynthetic cell clusters. (a) An UpSet plot shows numbers of cells harboring individual gene or combination of NaPAL4, Na4CL1, NaPKS2, and NaAER1 genes. A pie chart represents the distribution of clusters of cells expressing all four genes. Clusters 0, 3, and 4 (epidermis) contain 94.3% of cells co‐expressing all four genes. (b) Featureplots visualize co‐expression between NaPAL4 and Na4CL1, NaPKS2, and NaAER1, respectively. Cells that co‐express genes mostly locate in cluster 0. (c) Dotplots of l‐phenylalanine (Phe) biosynthetic genes (primary metabolism) and BA biosynthetic genes (secondary metabolism). Phe is mainly synthesized in clusters 0 to 4, and BA synthesis occurs in clusters 0, 3, and 4. NaPAL4, Nicotiana attenuata phenylalanine ammonia‐lyase 4; Na4CL1, N. attenuata 4‐coumarate:CoA ligase; NaPKS2, N. attenuata polyketide synthase 2; NaAER1, N. attenuata 2‐alkenal reductase 1; DAHPS, phospho‐2‐dehydro‐3‐deoxyheptonate aldolase; DHQS, 3‐dehydroquinate synthase; DHQD/SD, bifunctional 3‐dehydroquinate dehydratase/shikimate dehydrogenase; SK, shikimate kinase; EPSPS, 3‐phosphoshikimate 1‐carboxyvinyltransferase 1; CS, chorismate synthase; CM, chorismate mutase; PAT, bifunctional aspartate aminotransferase and glutamate/aspartate‐prephenate aminotransferase; ADT, arogenate dehydratase/prephenate dehydratase.
