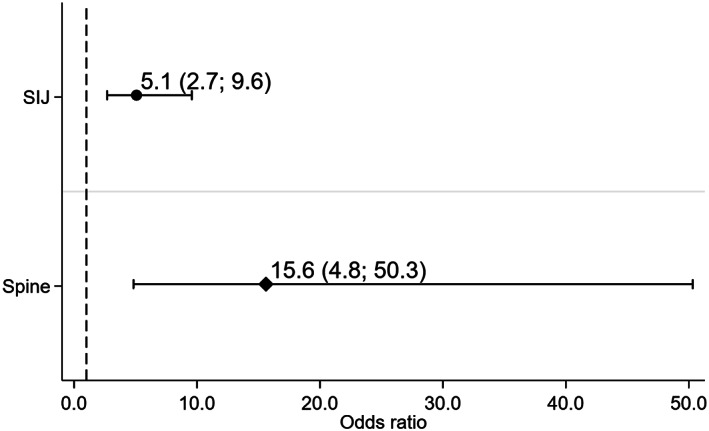
Figure 2.

The effect of bone marrow edema (according to the Assessment of SpondyloArthritis international Society definition) on structural damage (defined as ≥3 fatty lesions) over 5 years both in the sacroiliac joints (SIJ) and spine (longitudinal time‐lagged models with autoregression). Circles represent ≥3 fatty lesions on MRI of the SI joints. Diamonds represent ≥3 fatty lesions on MRI of the spine. Bars show the 95% confidence interval. MRI = magnetic resonance imaging.
