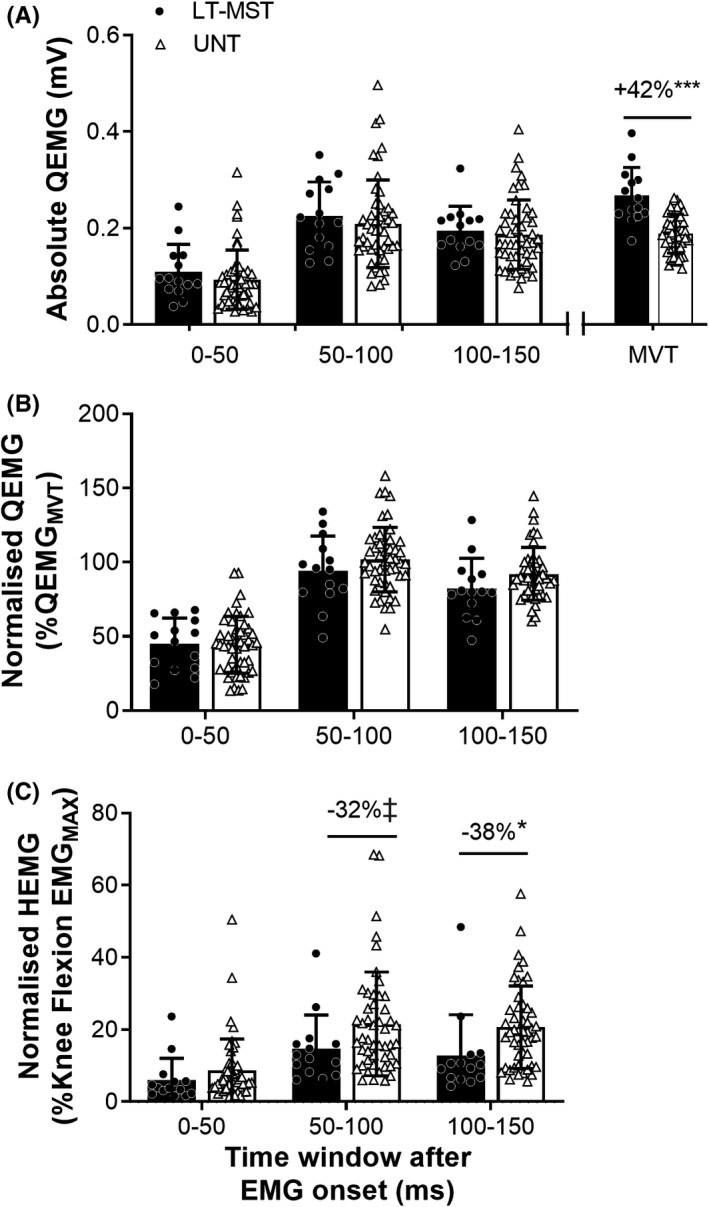
FIGURE 3.

(A) Absolute agonist (Q) electromyography (EMG), (B) Normalized agonist EMG, and (C) Normalized antagonist (H) EMG during maximum voluntary torque production (MVT) and explosive contraction (0–50, 50–100, and 100–150 ms after EMG onset) of the knee extensors for long‐term maximum strength‐trained (LT‐MST, n = 14) and untrained (UNT, n = 49) groups. For absolute QEMG, root‐mean‐square amplitude was corrected for muscle‐electrode distance (ie, adiposity). Knee flexion EMGMAX, agonist EMG during knee flexion MVT. Symbols denote differences between the two groups (independent sample t‐tests) as follows: ‡p = 0.096 (tendency), *p < 0.05, ***p < 0.001. Percentage difference values denote difference in the LT‐MST group mean relative to UNT group mean
