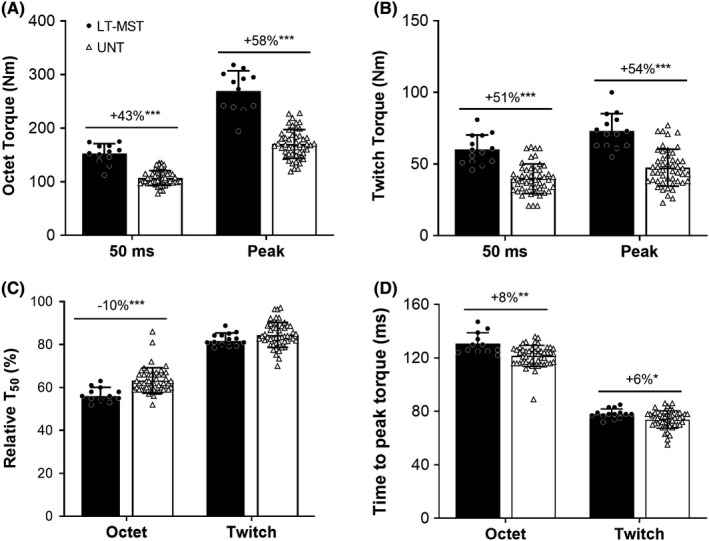
FIGURE 4.

Absolute torque 50 ms after torque onset and at peak torque during evoked octet (A) and twitch (B) contractions, as well as relative torque after 50 ms (to peak torque, C) and time to peak torque (D) during these contractions for long‐term maximum strength‐trained (LT‐MST, n = 12) and untrained (UNT, n = 49) groups. Symbols denote differences between the two groups (independent sample t‐tests) as follows: *p < 0.05, **p < 0.01; ***p < 0.001. Percentage difference values denote difference in the LT‐MST group mean relative to UNT group mean
