
FIGURE 3.
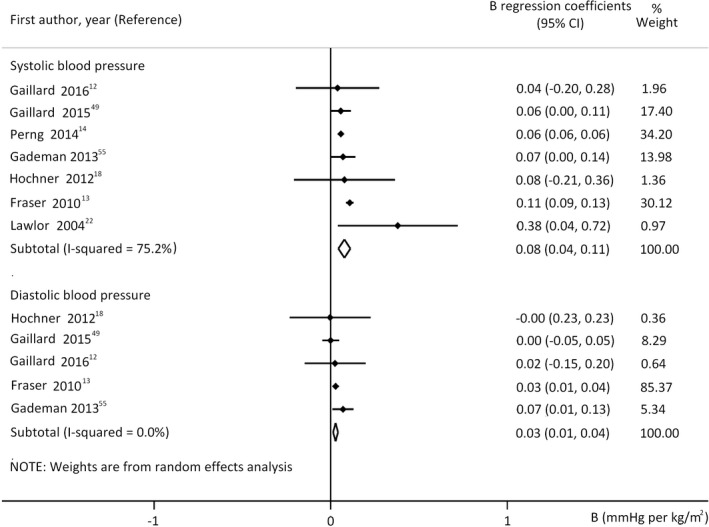
Regression coefficients (B) adjusted for offspring's actual nutritional state (model 2) describing the association between prepregnancy body mass index and offspring's systolic (upper panel n = 26134 mother‐offspring pairs) or diastolic blood pressure (lower panel n = 16603 mother‐offspring pairs). Horizontal bars indicate 95% confidence intervals (95% CI). Diamonds show the overall point estimate with 95% CI