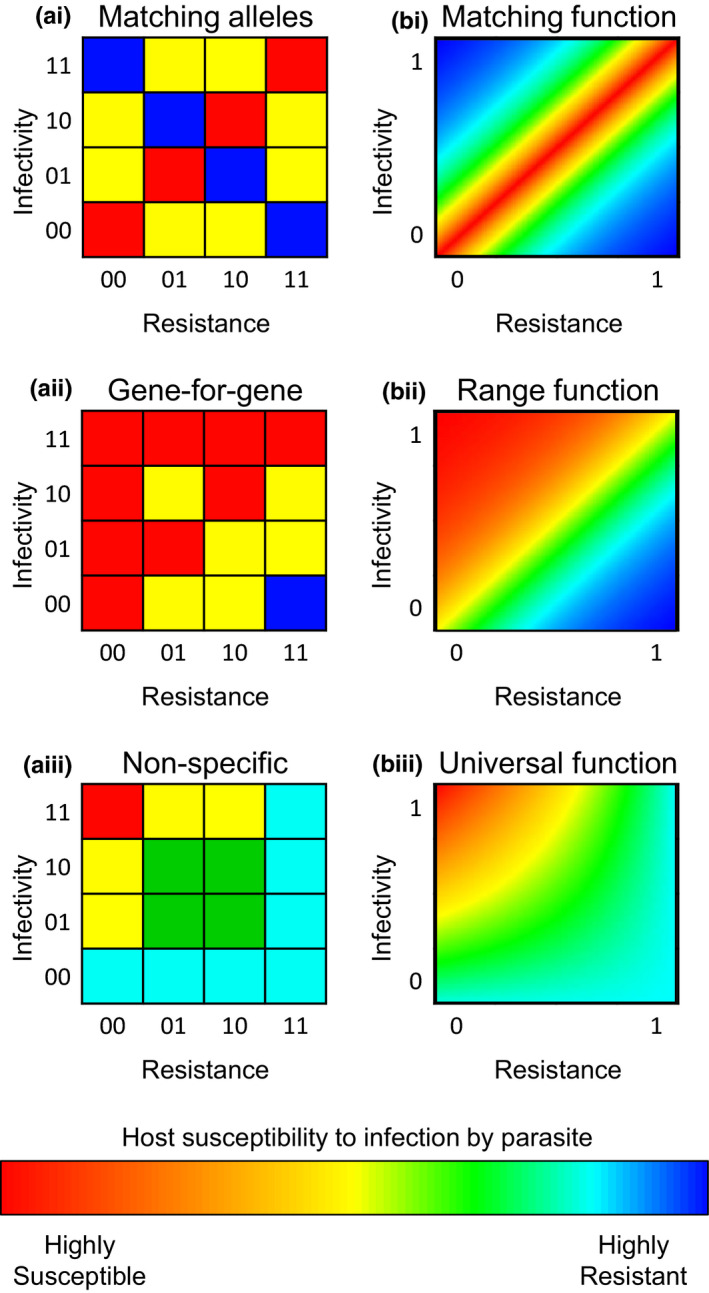
FIGURE 2.

Heatmaps showing example interactions between hosts and parasites, under various models of infection genetics. Red indicates that the host is highly susceptible to the parasite and blue that it is highly resistant. The columns show (a) population genetic and (b) quantitative genetic models. For population genetic models, host and parasite genotypes are indicated by binary strings of length two, with 1 indicating the presence of a resistance or infectivity allele at that locus, giving four possible genotypes in each population. For quantitative genetic models, host and parasite phenotypes are represented by continuous traits between 0 and 1, where 1 indicates the maximum trait value. The rows show example infection genetics when there is (i) high, (ii) varied and (iii) no specificity
