
Figure 2. Clinical Response and Survival of 116 Patients.
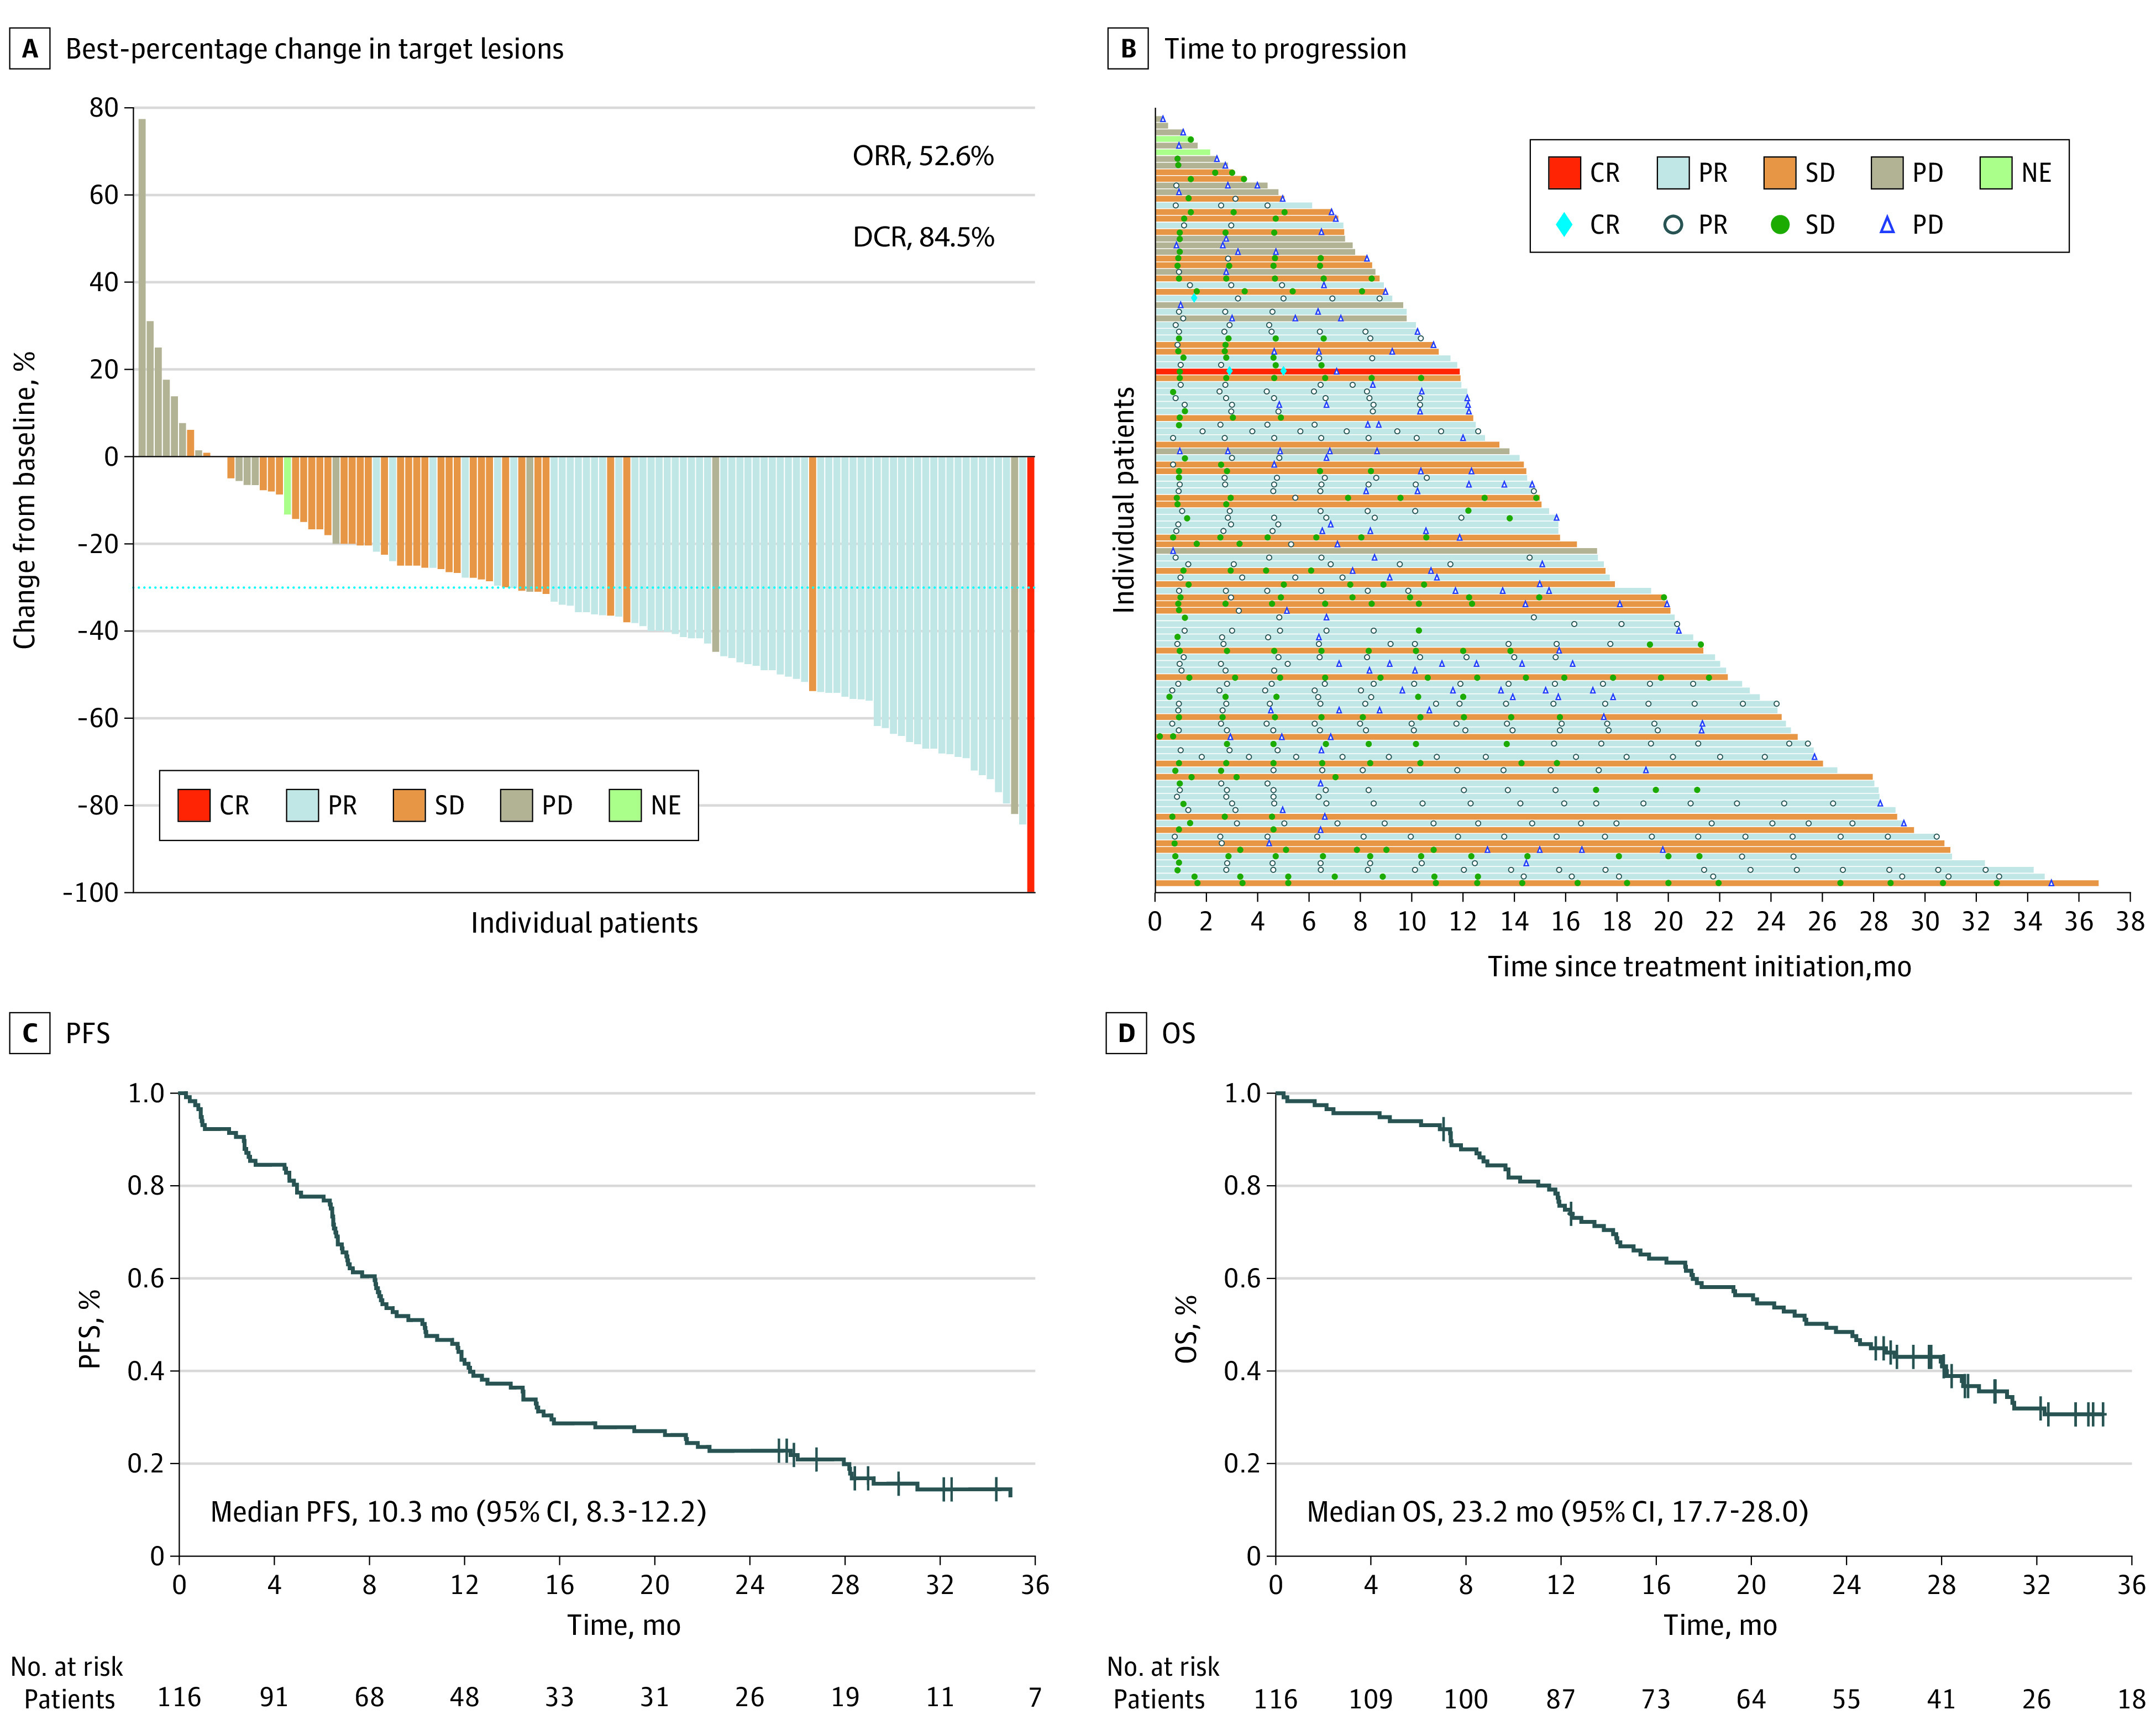
A, Waterfall plot of best-percentage change in target lesions from baseline during icotinib treatment. B, Swimmer plot of time to progression during icotinib treatment. C, Kaplan-Meier estimates of progression-free survival (PFS). D, Kaplan-Meier estimates of overall survival (OS). CR indicates complete response; DCR, disease control rate; NE, not evaluable; ORR, overall response rate; PD, progressed disease; PR, partial response; SD, stable disease.