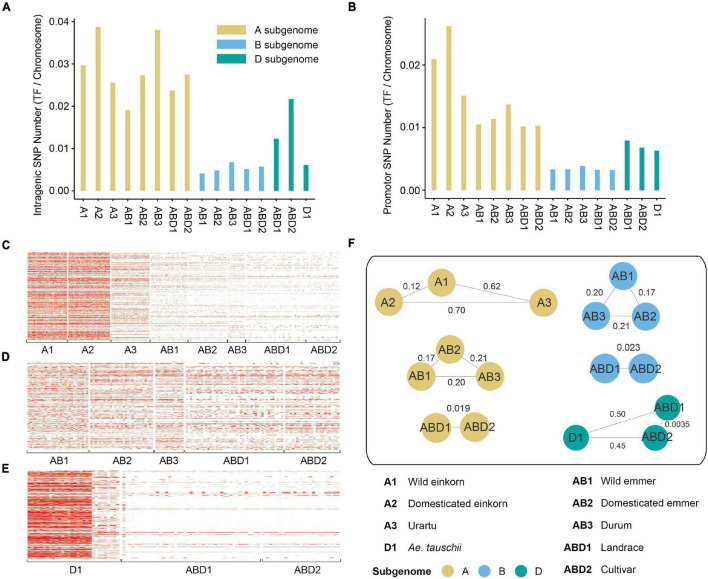
FIGURE 2.
SNP density and population analysis of TF genes. (A). The number of SNPs within TF gene region in each group. (B) The number of SNPs within TF promotor region in each group. (C–E) The density of SNPs within gene and promotor region on panels (C) A, (D) B, and (E) D subgenomes. (F) The Fst values between different groups. The values on the lines represent Fst.

