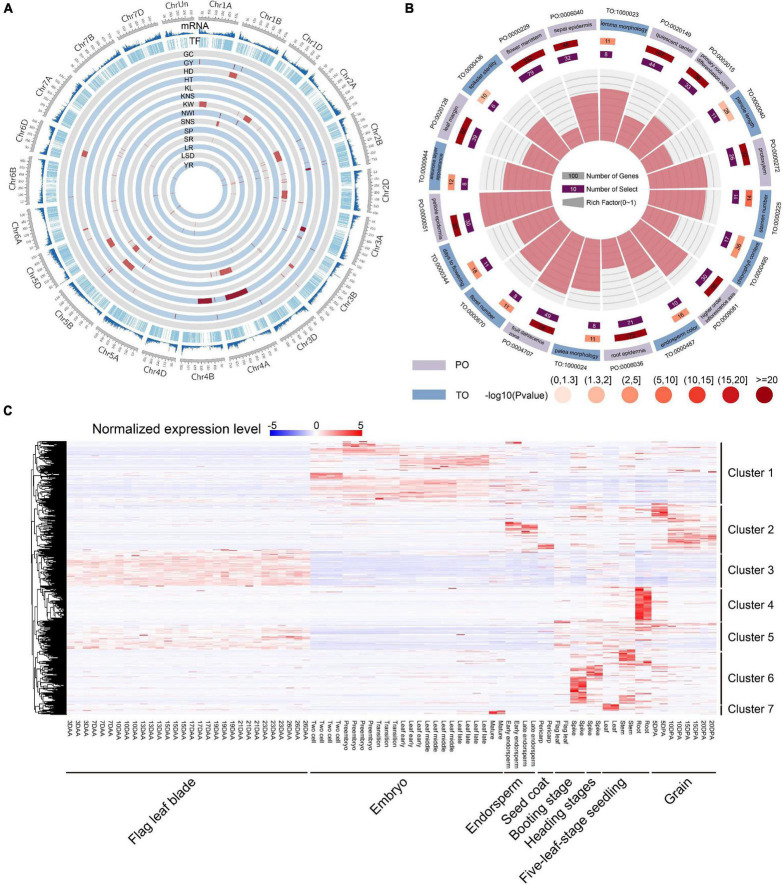
FIGURE 3.
Function analysis and expression heatmap of TF genes. (A) Summary of total gene density, TF density, and the distribution of 124 known QTLs of 14 agronomic traits of wheat. (B) Top 20 PO and TO enrichment terms of TF genes. (C) Expression profiles of TF genes in eight different tissues and time points. Clusters 1–7 on the right represent classification according to gene expression specificity. DAA represents days after anthesis; DPA represents days post-anthesis.

