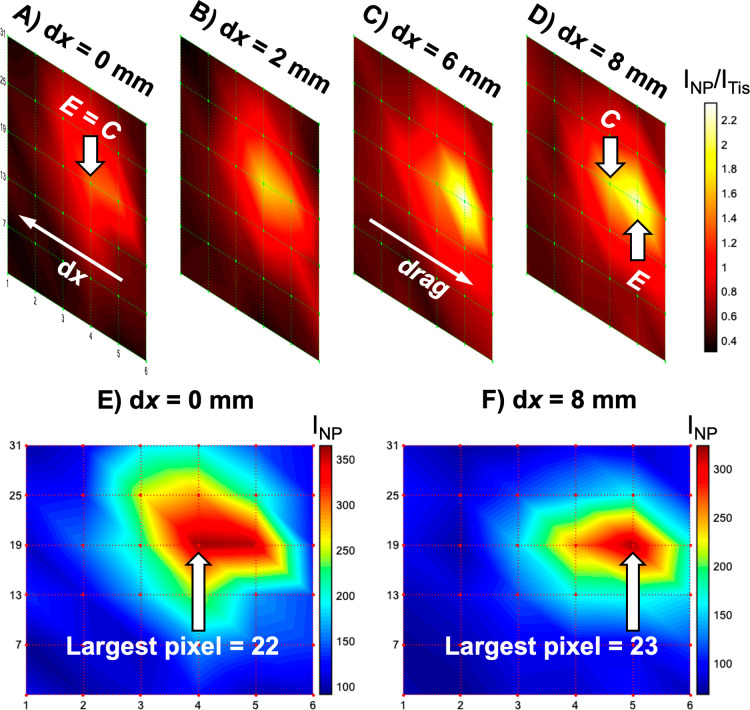
Figure 2.
Ratiometric SESORS imaging with a variable offset reveals the effect we termed as linear offset-induced image drag. To observe this, the PPY powder was buried 15 mm behind the tissue barrier, and images were collected independently on an in-house-built fixed SORS system across a 25 × 25 mm grid in 5 mm steps with linear offset magnitudes of (A) 0, (B) 2, (C) 6, and (D) 8 mm. Note that in (D), the collection point is highlighted for the highest intensity pixel, i.e., the excitation point where the largest intensity ratio was detected. The color bar across the set of offset images was scaled for clarity to indicate the offset that maximized the intensity ratio, INP/ITis. Intensity SESORS images, where each pixel corresponds to INP, were recorded with linear offset magnitudes of (E) 0 and (F) 8 mm to clearly display the effect of linear offset-induced image drag. Spectra were collected for 1 s using a laser power of 400 mW.

