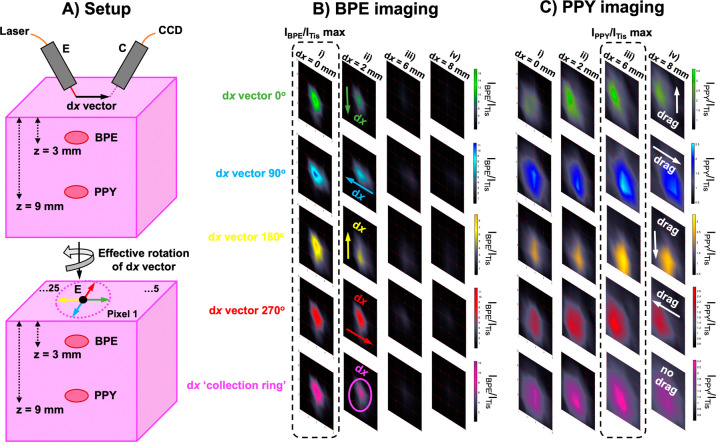
Figure 6.
3D imaging and spatial discrimination of two flavors of SERS nanotags simultaneously using ring-collection ratiometric SESORS. (A) Schematic showing the spatial discrimination experiment setup; images were collected of the BPE and PPY powders beneath 3 and 9 mm of tissue in the same sample across a 20 × 20 mm grid in 5 mm step sizes with various linear offset magnitudes. This was repeated three times with the sample being rotated through 360° in 90° steps to mimic the rotation of the linear offset vector, and the resulting vectors were termed with respect to the orientation of the vector in the initial set of dx “0°” (green) images as dx “90°” (blue), dx “180°” (yellow), and dx “270°” (red). Ratiometric images were averaged across the four linear offset vectors to mimic a ring-collection offset (pink). (B) Ratiometric images were collected of the BPE powder buried beneath 3 mm of the tissue across a 20 × 20 mm grid in 5 mm step sizes with linear offset magnitudes of (i) 0, (ii) 2, (iii) 6, and (iv) 8 mm. This was repeated three times with the sample being rotated through 360° in 90° steps to mimic the rotation of the linear offset vector, and the resulting vectors were termed with respect to the orientation of the vector in the initial set of dx “0°” (green) images as dx “90°” (blue), dx “180°” (yellow), and dx “270°” (red). The ratiometric images were averaged across the four linear offset vectors to mimic a ring-collection offset (pink) at each offset magnitude. (C) Ratiometric images were collected of the PPY powder buried beneath 9 mm of the tissue across a 20 × 20 mm grid in 5 mm step sizes with linear offset magnitudes of (i) 0, (ii) 2, (iii) 6, and (iv) 8 mm. This was repeated three times with the sample being rotated through 360° in 90° steps to mimic the rotation of the linear offset vector, and the resulting vectors were termed with respect to the orientation of the vector in the initial set of dx “0°” (green) images as dx “90°” (blue), dx “180°” (yellow), and dx “270°” (red). The ratiometric images were averaged across the four linear offset vectors to mimic a ring-collection offset (pink) at each offset magnitude. The color bars across each set of ratiometric images were scaled for clarity to indicate the offset that maximized the intensity ratio, INP/ITis. Spectra were collected for 1 s using a laser power of 400 mW.

