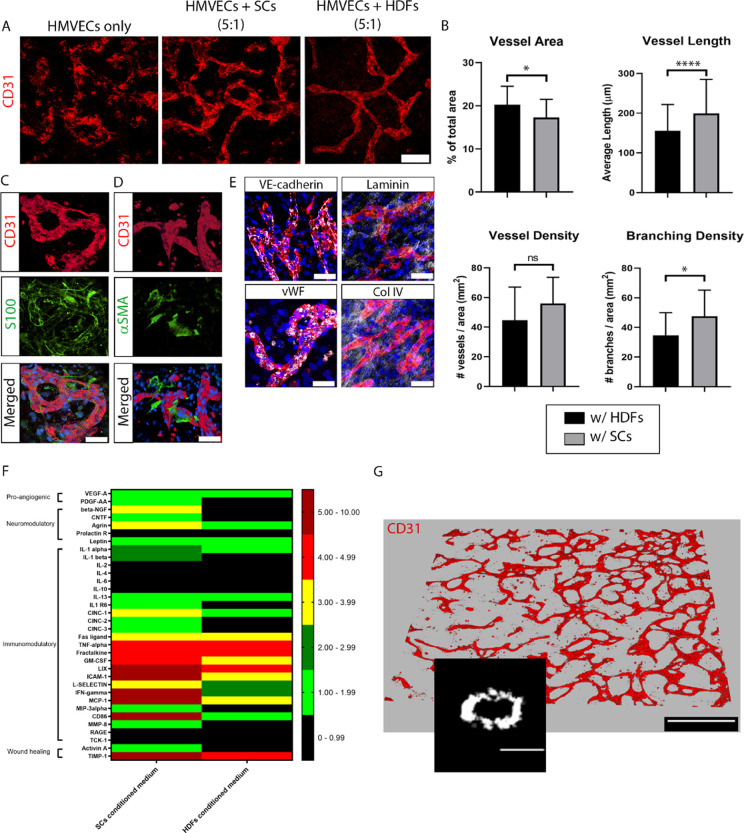
Figure 3.
Formation and characterization of a 3D vascular channel network composed of HMVECs and SCs. (A) Comparison of vascular networks stained by CD31 (red) after 10 DIV, composed of HMVECs only (left), HMVECs plus HDFs at 5:1 ratio (middle), and HMVECs plus SCs at 5:1 ratio (right). Scale bar represents 100 μm and applies to all images. (B) Quantification of vessel area (top left), vessel length (top right), vessel density (bottom left), and branching density (bottom right) formed in co-cultures of HMVECs with either SCs (black bars) or HDFs (gray bars). The bars represent the mean ± standard deviation (SD) of two experiments using ≥4 replicates per condition. For the image analysis, we took at least five images per sample. Statistics were performed using an unpaired t-test, where ****p < 0.0001, *p < 0.05, and ns denotes p > 0.05. (C, D) Micrographs depict an intimate association between vessels (CD31; red, top row) and SCs (S100; green, middle left) that also express α smooth muscle actin (αSMA; green, middle right). The bottom row shows the merged images. Scale bars represent 50 μm and apply to panels in the same column. (E) Vascular vessels resulting from the co-culture of HMVECs and SCs stained with the traditional markers (white in the respective panels): VE-cadherin (top left), laminin (top right), vWF (bottom left), and col IV (bottom right). CD31 is shown in red and DAPI in blue. Scale bars represent 50 μm. (F) Comparison of a cytokine array present in SC- (left column) versus HDF-conditioned medium (right column). The secreted amount of each cytokine was normalized to a normal, control medium. The value of the ratio between conditioned and normal medium for each cytokine was translated to a color code, denoted 0–0.99 (black), 1.00–1.99 (light green), 2.00–2.99 (dark green), 3.00–3.99 (yellow), 4.00–4.99 (red), and 5.00–10.00 (dark red). Cytokines were organized into categories representing their most prominent function, such as pro-angiogenic, neuromodulatory, immunomodulatory, or wound healing. (G) Reconstruction of a vascular network stained by CD31 (red) showing the formation of well-defined, 3D interconnected vessels with lumens (inset, average diameter of 4.6 μm). Scale bar in the network overview represents 500 μm and in the inset, 5 μm.

