Figure 6.
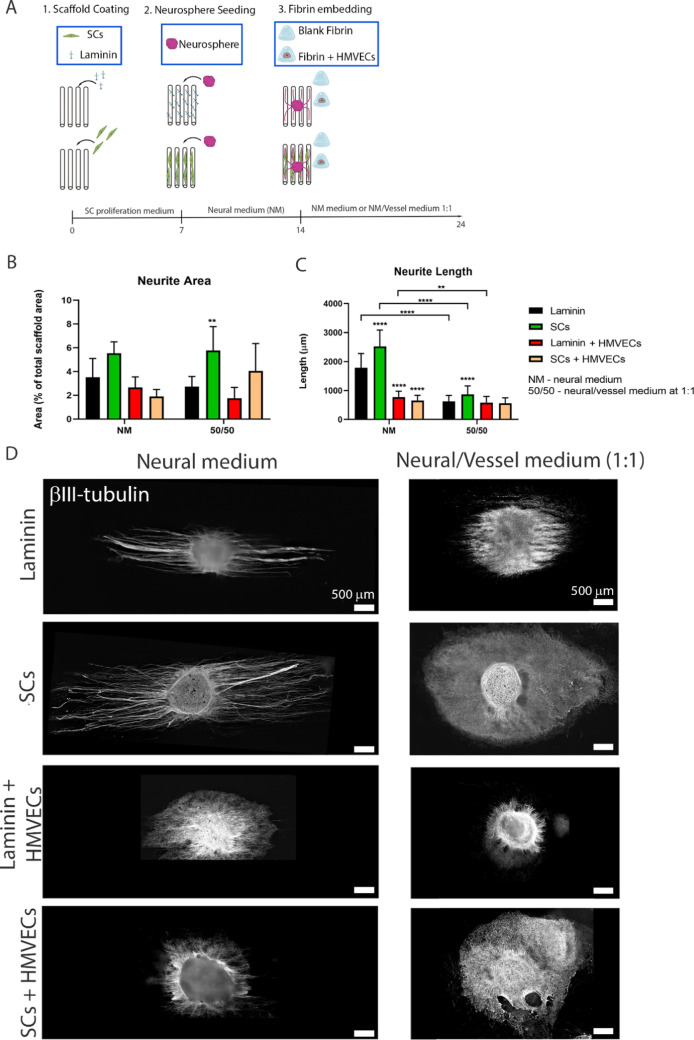
Development of the combined NV platform and neural tissue assessment. (A) Illustration of the followed strategy. Aligned microfibrous scaffolds were coated with either laminin (1 μg/mL) or seeded with SCs (100 × 103 cells per scaffold). The cultures were maintained for 7 DIV in the SC proliferation medium to allow SCs to populate the scaffold. On day 7, one neurosphere was added to each scaffold. The culture medium was then switched to neural medium (NM) and maintained for 7 days to induce neurite outgrowth. On day 14, 300 μL of blank fibrin or fibrin containing 1.5 M HMVECs/mL was added and the cultures were maintained for 10 DIV in either full NM or a 1:1 mixed NM and VM. Illustration made with biorender (https://biorender.com/). Quantification of the neurite area (B) and neurite length (C) between samples of laminin-coated scaffolds plus blank fibrin (black bars); SC-seeded scaffolds plus blank fibrin (green bars); laminin-coated scaffolds plus HMVEC-laden fibrin (red); or SC-seeded scaffolds plus HMVEC-laden fibrin (light orange bars). The samples were cultured in NM (left set of bars) or 1:1 NM/VM (right set of bars). The bars represent the mean ± SD from at least five replicates per condition in two independent experiments. The whole sample was measured to quantify the neurite area and neurite length (see the Methods section). At least 20 measurements were taken per sample. Statistics were performed via two-way analysis of variance (ANOVA) followed by Tukey’s multiple comparison test, where ****p < 0.0001 and ** p < 0.01. Comparisons were done relative to laminin coating and blank fibrin samples (for each medium group). (D) Neurite morphology after culture in the eight different platform conditions, via immunostaining to βIII-tubulin (white). Scale bars represent 500 μm.

