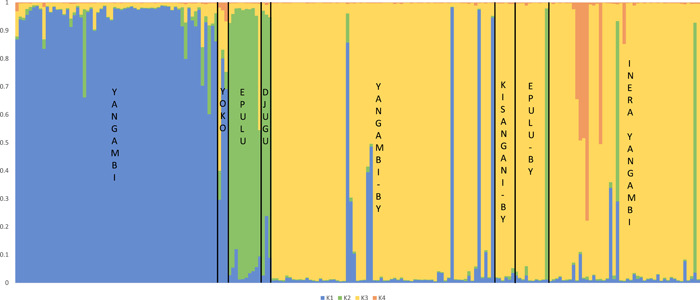
Figure 2.

Bar plot of assignment probabilities (vertical axis) for the most likely number of genetic clusters K = 4 in the Coffea canephora microsatellite data set, inferred using the program structure (Pritchard et al., 2000)

Bar plot of assignment probabilities (vertical axis) for the most likely number of genetic clusters K = 4 in the Coffea canephora microsatellite data set, inferred using the program structure (Pritchard et al., 2000)