Table 1.
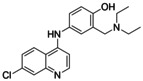
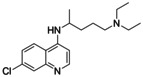
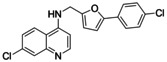
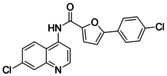
Nurr1 agonism of the purified compounds 3 j, 4, 4 e, and 5. AQ (1), [29] CQ, [29] 2 [24] and lead fragment 3 [24] for comparison. Fold activation refers to the maximum Nurr1 activation vs. DMSO (0.1 %). Data are the mean±S.E.M., n≥3.
|
ID |
structure |
EC50(Nurr1) (fold act.) |
|---|---|---|
|
AQ |
|
36±4 μM (3.6±0.1‐fold) |
|
CQ |
|
47±5 μM (2.0±0.1‐fold) |
|
2 |
|
1.8±0.3 μM (1.47±0.03‐fold) |
|
3 |
|
259±70 μM (2.5±0.4‐fold) |
|
3 j |
|
8±1 μM (2.5±0.1‐fold) |
|
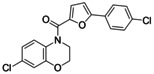
4 |
|
3.0±0.1 μM (2.0±0.1‐fold) |
|
4 e |
|
6±2 μM (1.40±0.05‐fold) |
|
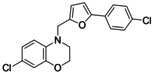
5 |
|
47±13 μM (2.0±0.2‐fold) |