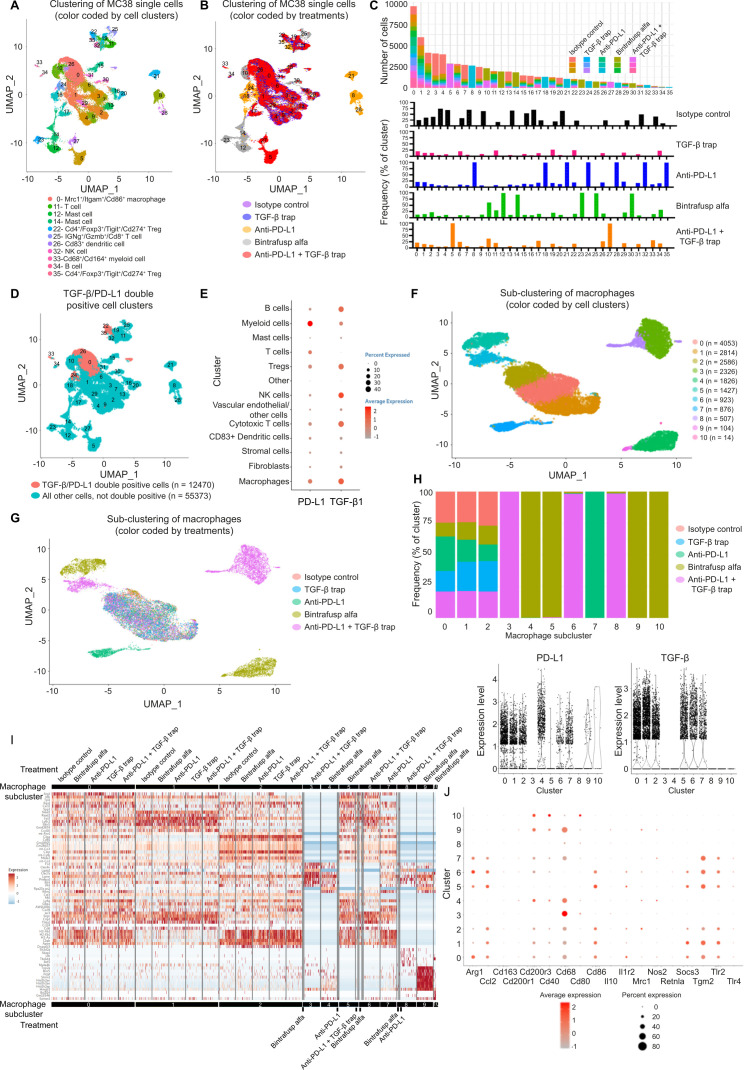
Figure 5.
Evaluation of TME reprogramming and identification of cell populations co-expressing TGF-β and PD-L1. C57BL/6 mice (n=3 per group) bearing MC38 were treated as described in figure 4 legend. Mice were sacrificed on day 6 and tumor samples were dissociated for scRNAseq. (A) UMAP representation and graph-based clustering of merged scRNAseq data from all treatment groups. Cell clusters were annotated by evaluation of canonical markers for different cell lineages (PanglaoDB: single cell sequencing resource for gene expression data; https://panglaodb.se) and the DEGs computed between two groups cells using the MAST algorithm. Cell clusters were annotated that the average expression of the group of markers is greater than 1 unit and the percentage of expression is greater than 30. (B) UMAP representation of treatment-based differences. (C) Contribution to individual clusters by different treatment groups and treatment-specific clusters. (D) Cell clusters demonstrating high expression of TGF-β and PD-L1 were identified based on the average expression of both these genes above the selected cut-off of 0.5. The majority of co-expressing cells were found in clusters 0, 22, 24, 26, 33, and 35. (E) Expression levels of TGF-β and PD-L1 in annotated cell clusters. (F) Characterization of macrophages by subclustering revealed 11 distinct macrophage populations in the MC38 TME. (G) Treatment-specific subclusters were identified among macrophage populations. (H) TGF-β and PD-L1 expression levels in different macrophage subclusters. Newly emerged BA-specific clusters express low levels of TGF-β, PD-L1, or both. (I) Global assessment of the single-cell transcriptome profiles of macrophages showed that BA-induced macrophage populations possessed unique gene expression pattern. (J) Evaluation of key macrophage markers. BA-induced subclusters 4, 9, and 10 express lower levels of M2 markers and higher levels of M1 markers compared with common macrophage subclusters 0, 1, and 2. BA, bintrafusp alfa; DEGs, differentially expressed genes; MAST, model-based analysis of single-cell transcriptomics; PD-L1, programmed death-ligand 1; TGF-β, transforming growth factor-β; TME, tumor microenvironment; scRNAseq, single-cell RNA sequencing; UMAP, uniform manifold approximation and projection.

