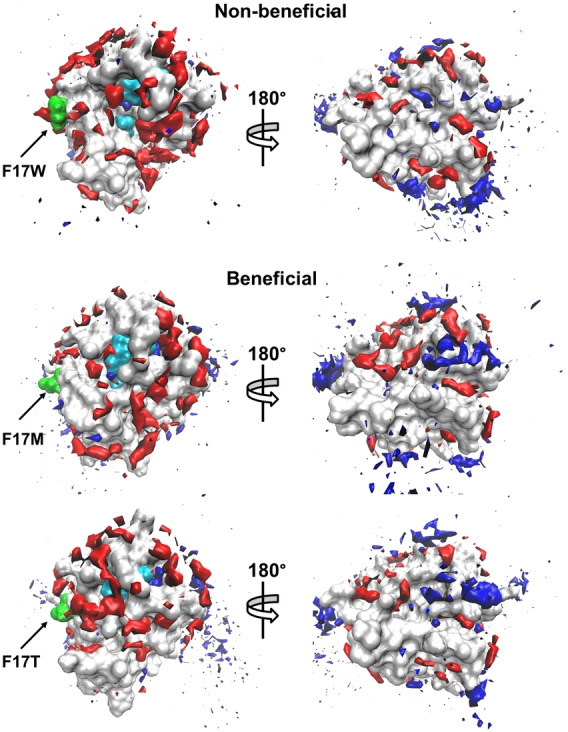
Figure 2.

Spatial distribution of water and DMSO occupancy at the surface of the BSLA variants on position F17 in 60 % (v/v) DMSO. The BSLA surface is shown in grey, S77, D133, H156 (the catalytic triad) in cyan, the OS molecules in red with a solid surface, the water molecules in blue with a solid surface. The substituted sites are labeled and shown in green. A 180° rotation view around the vertical axis is offered to give a complete view of the surface. The contours are shown with the isovalue 16, 9 for DMSO, water, respectively. Each view of the BSLA has the same orientation.
