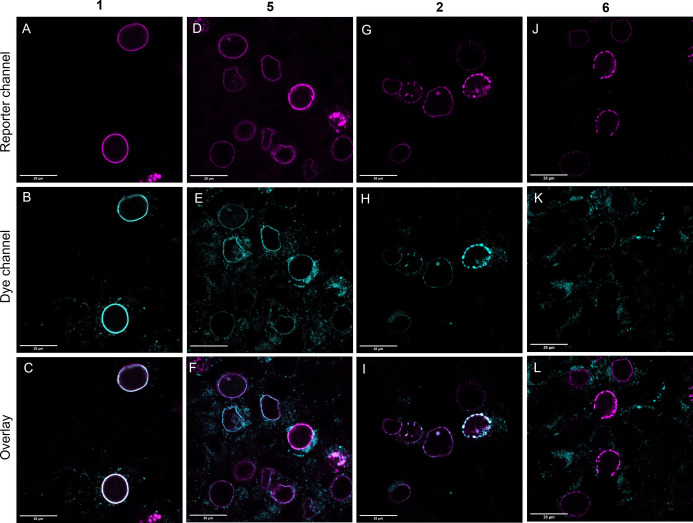
Figure 4.
Confocal microscopy images of Lamin‐LTAG‐miRFP (A–F) or Lamin‐GFPTAG (G–L) expressing HEK293T cells treated with Lys(BCN) and probes 1 (A–C), 2 (G–I) or 5 (D–F), 6 (J–L). Scale bar: 20 μm. Spectral detection: A,D) (miRFP/reporter channel): λexc: 633 nm/ λem: 645–800 nm; G,J) (GFP/reporter channel): λexc: 488 nm/ λem: 495–600 nm; B) (1): λexc: 405 nm/ λem: 560–600 nm; E) (5): λexc: 543 nm/ λem: 560–600 nm; H) (2): λexc: 405 nm/ λem: 620–800 nm; K) (6): λexc: 633 nm/ λem: 645–800 nm. Overlay pictures demonstrate the merged fluorescent signals of the reporter and dye channels.

