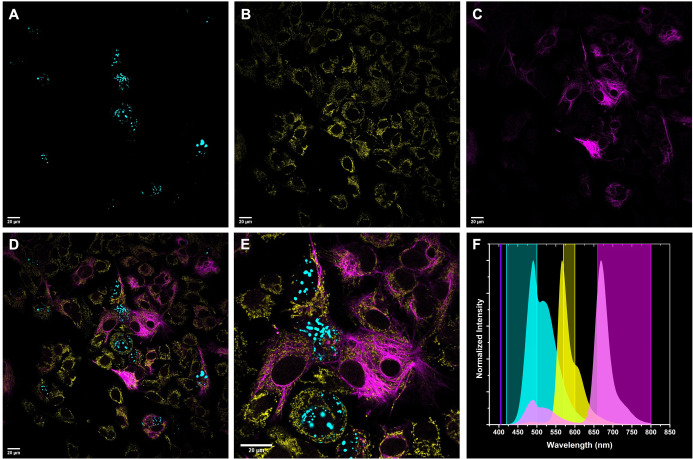
Figure 5.
Multicolor imaging of HepG2 cells. A) Lamin‐HaloTag treated with 7 tagged Halo‐substrate (Halo‐7), λexc: 405 nm/ λem: 420–500 nm); B) TOMM20 stained with 1‐tagged antibody, λexc: 405 nm/ λem: 570–600 nm); C) CK‐19 stained with 2‐tagged antibody, λexc: 405 nm/ λem: 660–800 nm; D) Overlay of A, B and C; E) magnification of D, Scale bar: 20 μm; F) Emission spectra of dyes 7 (cyan), 1 (yellow) and 2 (magenta) together with excitation wavelength (405 nm) and detection windows.

