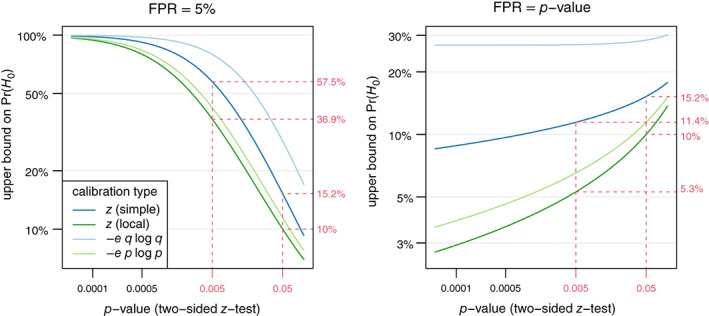
FIGURE 6.

The left plot shows the upper bound on the prior probability to achieve a false positive risk of 5% as a function of the p‐value calibrated with either a z‐test calibration (simple or local alternatives) or with the or calibrations, respectively. The right plot shows the upper bound on as a function of the p‐value using the same calibrations but assuming the p‐value equals the [Colour figure can be viewed at wileyonlinelibrary.com]
