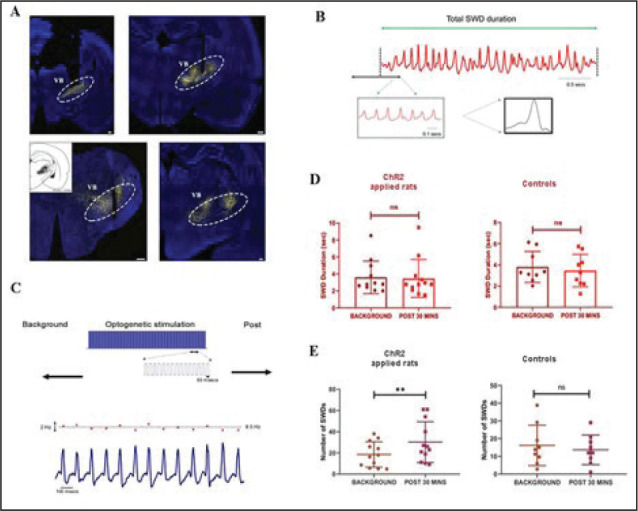
Figure 3. Injection and recording of WAG-Rij animals. (A) Virus injection sites of the VB thalamus. (B) A sample recording of a burst of SWD. (C) Representation of the optogenetic stimulation pulses on the upper part. The lower part shows a sample figure depicting the instantaneous firing rate of the SWD (red dots in the upper trace) and electrophysiological recording (lower trace). (D) The average duration of SWD before and after optogenetic stimulation in ChR2 (left) and control (right) virus injected WAG-Rij. (E) The average number of SWD before and after optogenetic stimulation in ChR2 (left) and control (right) virus injected WAG-Rij. **P < .01, Error bars are standard deviation. The background and poststimulus region were 30 min. Scale bars of the images are 300 µm for upper left, 400 µm for upper right and below left, and 200 µm for the lower right.

