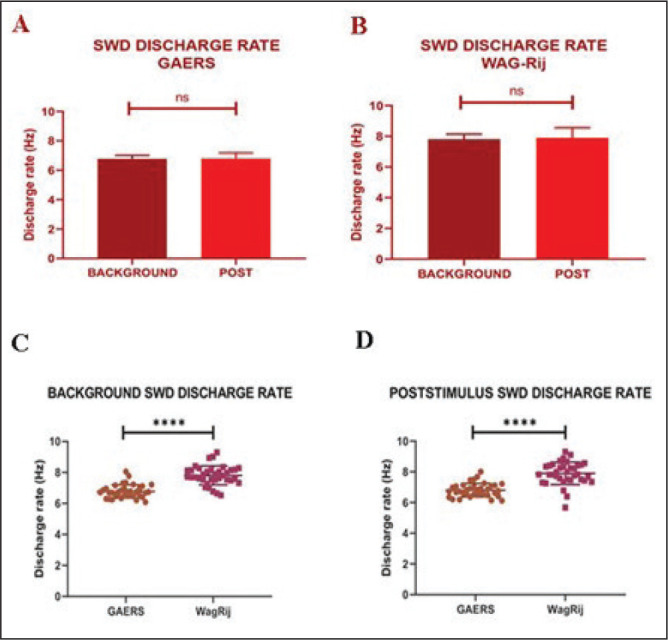
Figure 4. . The difference between background and poststimulus SWD discharge rates in (A) GAERS and (B) WAG-Rij rats. The comparison of the (C) background and (D) poststimulus firing rates of SWD between GAERS and WAG-Rij. ****P < .0001. Error bars are standard deviation.

