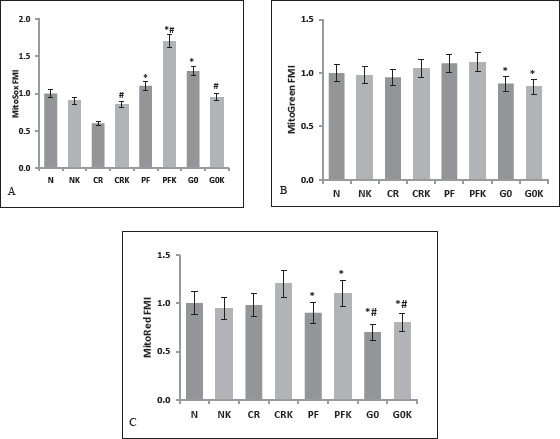
Figure 4. Flow-Cytometric Measurements, Cells Analyzed for Mitochondrial Functions.

Note: Data are expressed as mean ± SD (n = 7). A, MitoSOX (mitochondrial oxidant load-ROS) (n = 9) B, Mito Green (mitochondrial mass) (n = 7) and C, MitoRed (mitochondrial membrane potential) were measured (n = 7). N, (normal) control group (DMEM F12 + 10% FBS-300 mg/dL glucose containing medium); NK, ketone added to normal medium (DMEM F12 + 10% FBS + 5 mM b OHB); CR, calorie restriction model (EBSS + 10% FBS, 100 mg/dL glucose containing medium); CRK, ketone added to CR medium (EBSS + 10% FBS + 5 mM bOHB); PF, prolonged fasting model (EBSS: DMEM0 1:1 + 10% FBS, 50 mg/dL glucose containing medium); PFK, ketone added to PF medium (EBSS: DMEM0 1: 1 + 10% FBS + 5 mM bOHB), G0 (DMEM0 + 10% FBS, no-glucose containing medium); G0K, ketone added to G0 medium (DMEM0 + 10% FBS + 5 mM bOHB). * P < .01 when compared to N, # P < 0,01 when compared to the same group without bOHB.
