
FIGURE 3.
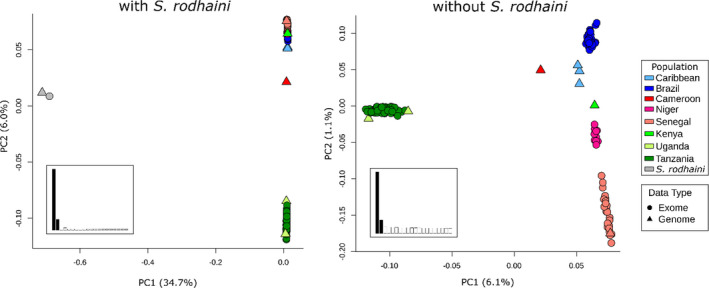
A principal component analysis (PCA) of unlinked autosomal single nucleotide variants. The PCA plot that included Schistosoma mansoni and S. rodhaini (left) clearly shows a large distinction between the two species with some variation within S. mansoni along PC2. A PCA with only S. mansoni (right) differentiates East African S. mansoni along PC1. The remaining S. mansoni samples fall along a continuum on PC2 that goes from samples in West Africa and transitions to the Americas. Inset bar charts represent the percentage variation explained along the first 20 PCs. Only PC1 and PC2 were examined (shaded)