
FIGURE 4.
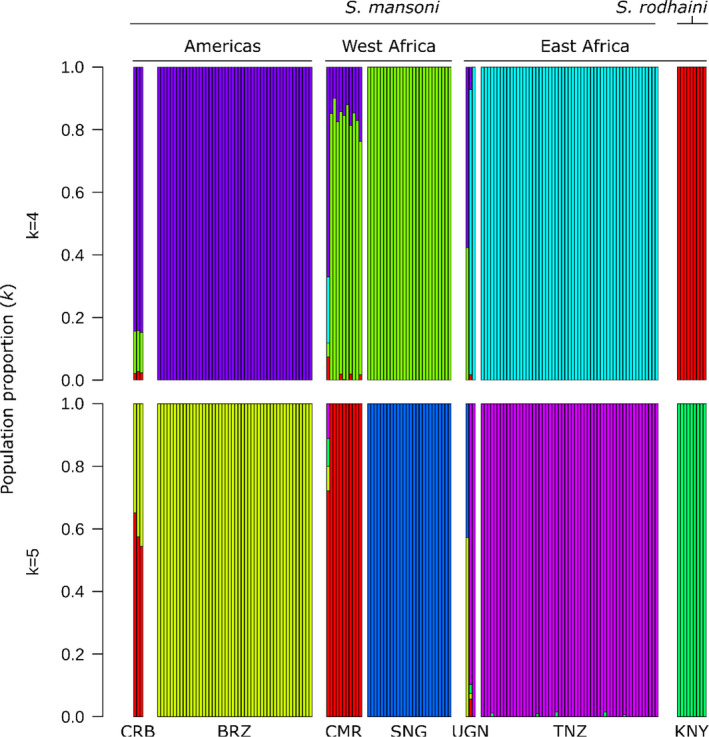
Population structure in Schistosoma mansoni. admixture analyses with k = 4 and k = 5 populations identified clear distinctions between each of the major sampling localities (the Americas, West Africa, East Africa and S. rodhaini). The population components in each of the whole genome samples from Uganda (UGN), Kenya (KNY), Cameroon (CMR) and the Caribbean (CRB) were more heterogeneous than samples with exome data. Cameroonian and Nigerien samples contain moderate proportions of the Brazilian population component. BRN, Burundi; BRZ, Brazil; NGR, Niger; SNG, Senegal; TNZ, Tanzania