
FIGURE 5.
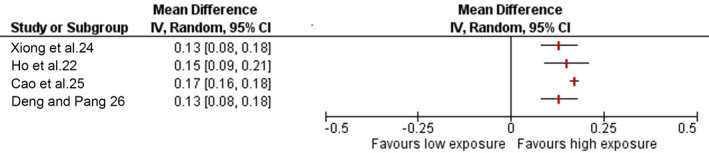
Forest plot showing pooled estimates of change in spherical equivalent refraction (SER) from baseline (1 year). *Did not report duration over which change was assessed
Official websites use .gov
A
.gov website belongs to an official
government organization in the United States.
Secure .gov websites use HTTPS
A lock (
) or https:// means you've safely
connected to the .gov website. Share sensitive
information only on official, secure websites.
Forest plot showing pooled estimates of change in spherical equivalent refraction (SER) from baseline (1 year). *Did not report duration over which change was assessed