
FIGURE 6.
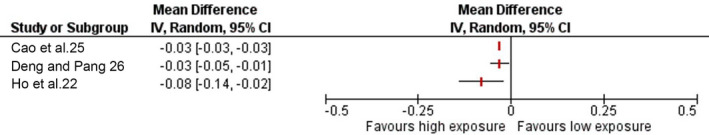
Forest plot showing pooled estimates of change in axial length from baseline (1 year). *Did not report duration over which change was assessed
Official websites use .gov
A
.gov website belongs to an official
government organization in the United States.
Secure .gov websites use HTTPS
A lock (
) or https:// means you've safely
connected to the .gov website. Share sensitive
information only on official, secure websites.
Forest plot showing pooled estimates of change in axial length from baseline (1 year). *Did not report duration over which change was assessed