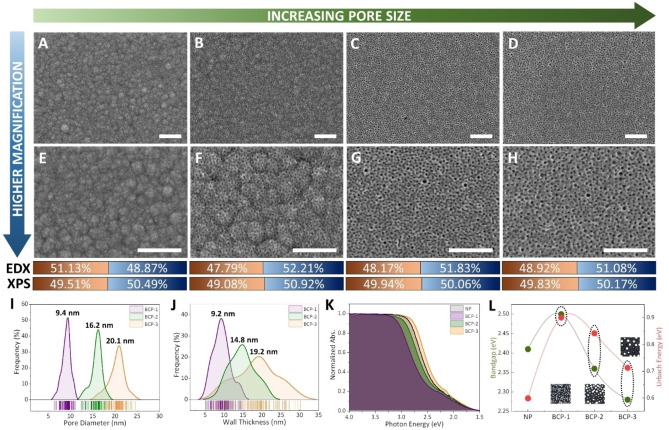
Figure 2.
Scanning electron microscopy (SEM) and spectrophotometry. Surface morphologies of A, E) NP, followed by B, F) BCP‐1 film, C, G) BCP‐2 film, and D, H) BCP‐3 film along with atomic percentages of copper in orange and telluride in blue examined by energy‐dispersive X‐ray analysis (EDX) and X‐ray photoelectron spectroscopy (XPS) for respective samples (scale bar: 250 nm). I) Pore diameter and J) wall thickness distribution. K) Normalized absorbance along with L) band gap (E g) and Urbach energy (E U) for varying pore diameters. The electrolytes containing micelles were prepared by mixing 0.35 mL of 80 mM Cu precursor solution and 0.65 mL of 80 mM Te precursor solution. The applied potential was −0.2 V (vs. Ag/AgCl).

