
FIGURE 1.
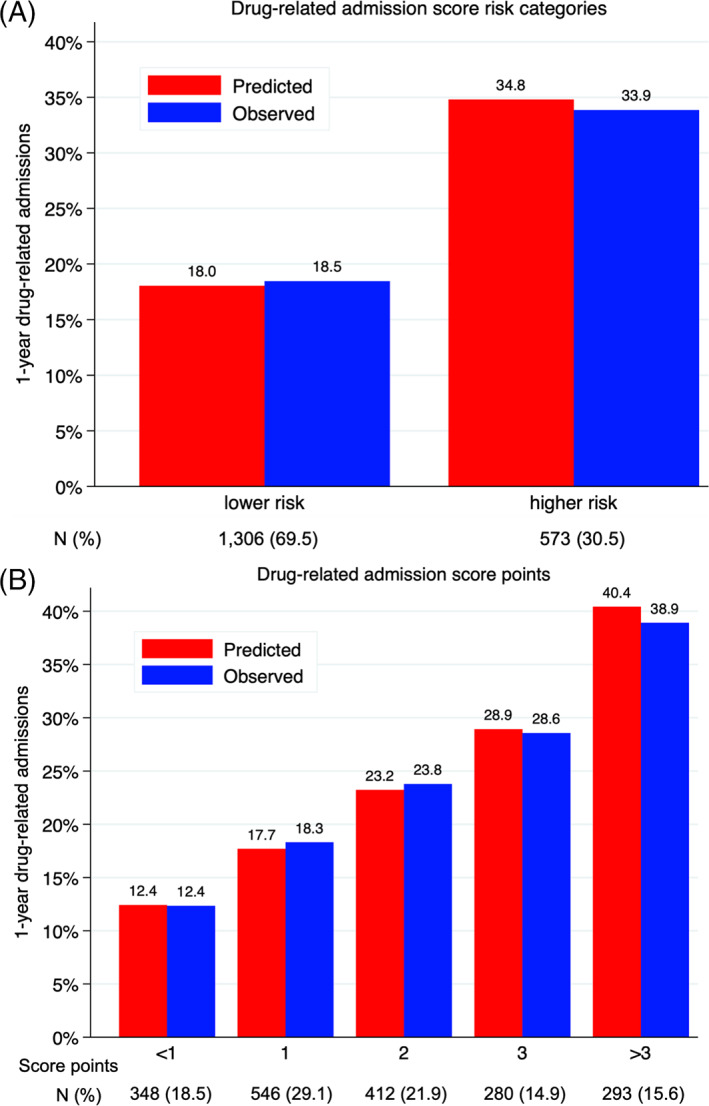
Calibration of the score to predict 1‐year drug‐related admissions. N, number of patients. Predicted versus observed drug‐related admissions at 1 year after discharge according to a) risk category; 2) score points. Score ranged from −3 to 9 points (for a maximum of 12 points). Point categories with <5% of patients were merged. Lower risk was defined as <3 points, and higher risk as ≥3 points, corresponding to the upper quartile