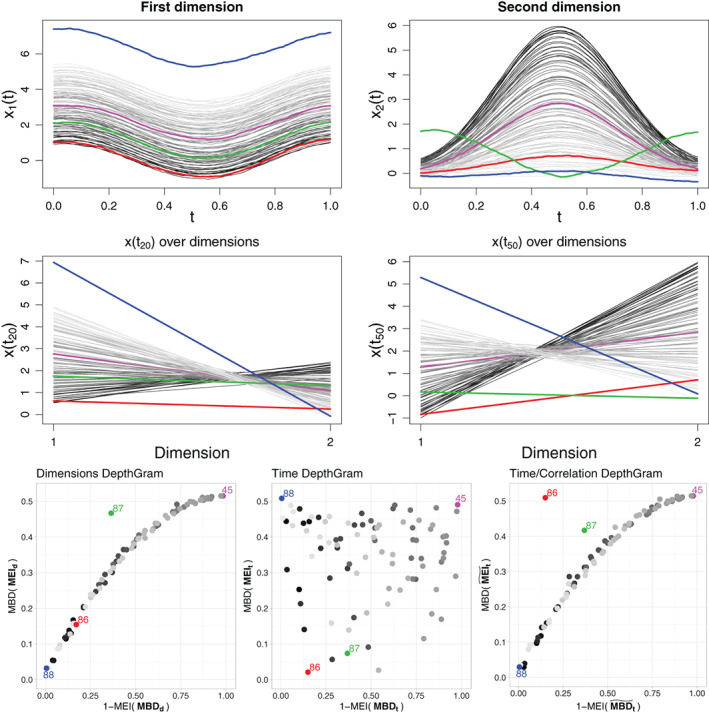
FIGURE 3.

First row: A bivariate functional dataset with reversed curve ordering between the two dimensions. Second row: Bivariate observations for and , represented using a parallel coordinate plot (the choice of time points is arbitrary and is adopted for illustration). Third row: DepthGrams. The same color is used across the figures to identify individual observations. The observation coded in red is a joint outlier, because low values in the first dimension are associated with low values in the second dimension, where the opposite holds for the rest of the curves in the sample. Because there are changes in the sign of the correlation among dimensions, the third Depthgram version is most suitable for identifying joint outliers
