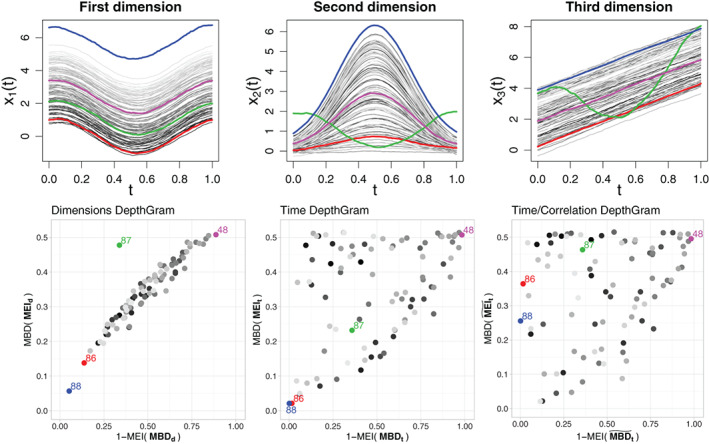
FIGURE 4.

First row: A three‐variate functional dataset with independent components. Second row: DepthGrams. The same color is used across the figures to identify individual observations. The observation depicted in red could be considered as a joint outlier, because low values in the first dimension are associated with low values in the second and third dimensions, while the rest of the curves behave independently across dimensions. The same is true for the blue observation, which, in addition, is a magnitude outlier in the first dimension. There is a spurious negative correlation between the second and third components of the dataset; hence, the time/correlation Depthgram differs from the time Depthgram. However, because no clear correlation pattern is present in the sample, both exhibit the same dispersed appearance
