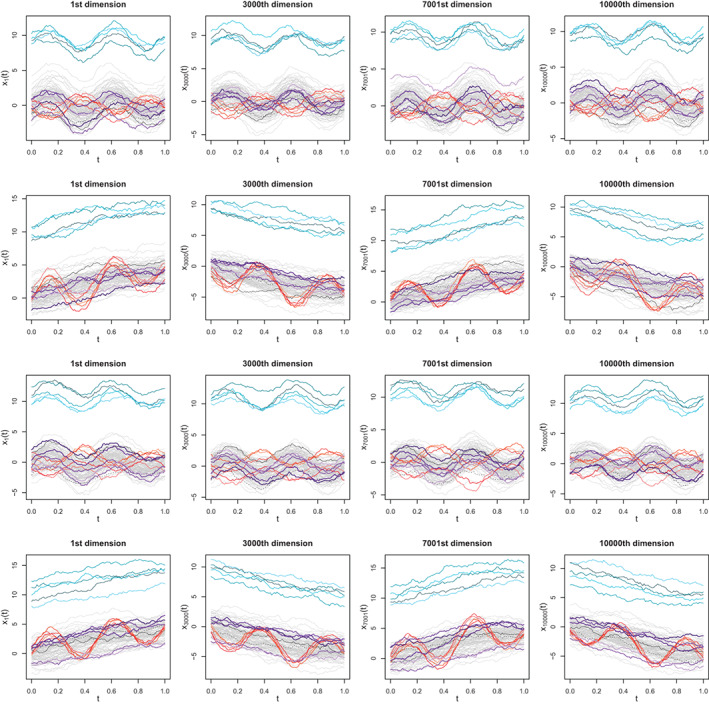
FIGURE 5.

Sample datasets of the four models and selected dimensions (, ). Each model is represented in a row, with row i corresponding to the ith model. Outliers are represented according to the following color code: Magnitude, shape, and joint outliers are displayed in blue, red, and purple shades, respectively. Two non‐outlying curves are presented in black with solid and dashed lines to help visualize how the relative ordering between curves changes across dimensions, which can also be observed by monitoring the changes in position of magnitude and shape outliers marginals. In Models 1 and 3, the ordering is preserved across dimensions while in Models 2 and 4 the ordering is reversed in odd and even dimensions. In Models 1 and 2, the relative ordering of joint outliers across dimensions is random, while in Models 3 and 4, it follows a pattern opposite to that of the rest of the sample
