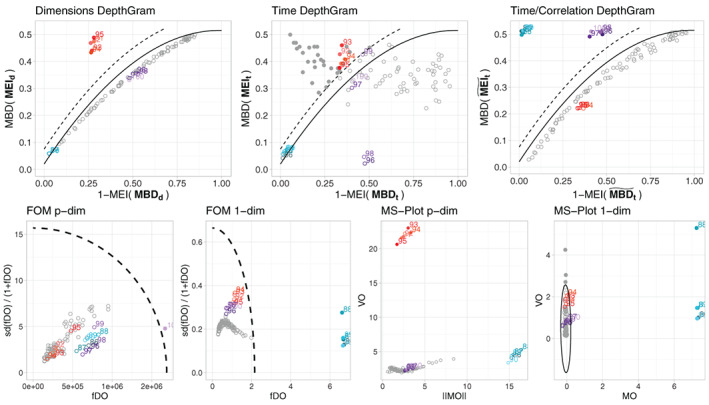
FIGURE 8.

Results for a single simulation run under Model 2, with , and . In the top row we present the three DepthGram representations. In the bottom row, we present the FOM and the MS‐plot in their p‐dimensional and 1‐dimensional versions. Except for the p‐dimensional MS‐plot, the boundary dividing the outlying and non‐outlying observations is drawn (a dashed line for the DepthGram and FOM and a solid ellipse for the MS‐plot). In all the plots, detected outliers are marked with a bullet while the rest of the observations are represented with a circle. True outliers are represented in color (blue for magnitude outliers, pink/red for shape outliers and purple for joint outliers) while non‐outlying observations are drawn in gray
