FIGURE 4.

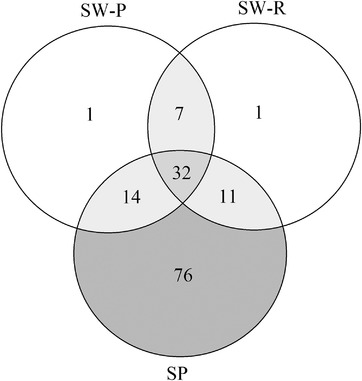
Venn diagram of the number of shared zOTUs of three saliva samples (SW‐P: swab collected by study participant; SW‐R: swab collected by researcher; SP: spit saliva)

Venn diagram of the number of shared zOTUs of three saliva samples (SW‐P: swab collected by study participant; SW‐R: swab collected by researcher; SP: spit saliva)