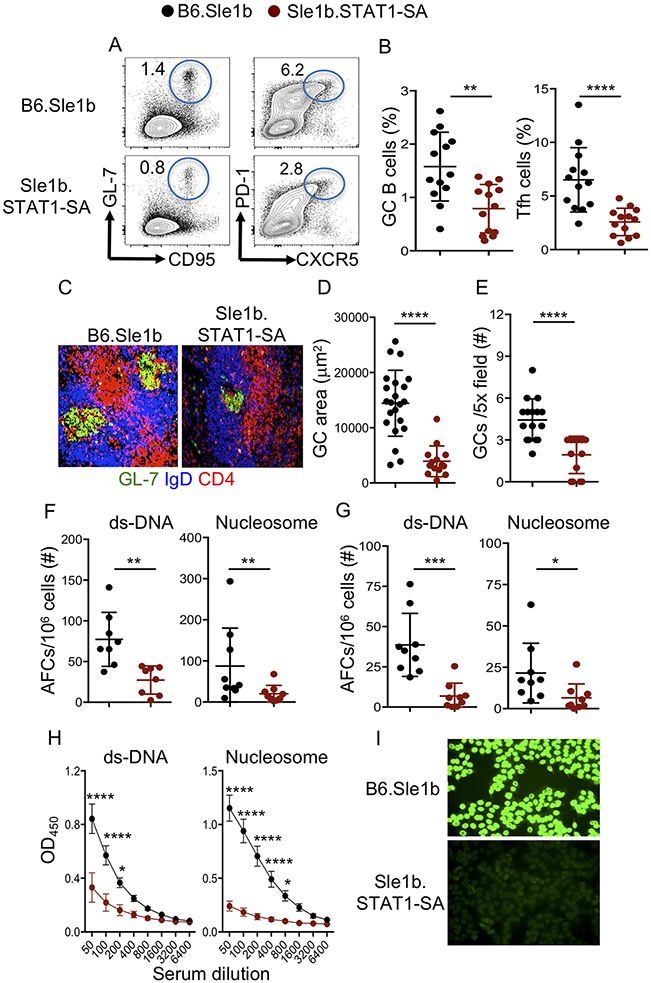
Figure 1. STAT1-pS727 regulation of autoimmune GC, AFC and autoAb responses.
Representative flow cytometry plots (A) and the percentage (B) of splenic B220+GL7hiCD95hi GC B cells of total B220+ B cells and CD4+CD44hiPD-1hiCXCR5hi Tfh cells of total CD4+ T cells. Representative histological images show GCs (C), quantification of GC area (D) and GC frequency (E) in spleens. Quantification of splenic (F) and BM (G) dsDNA- and nucleosome-specific AFCs by ELIspot. (H) dsDNA- and nucleosome-specific IgG Ab titers were measured by ELISA. (I) Representative images of serum ANA reactivity measured by Hep-2 clinical assay. The data shown were the cumulative results of three independent experiments generated from 5-6 mo old B6.Sle1b and Sle1b.STAT1-SA female mice. 3-5 mice were analyzed in each experiment. Each symbol indicates an individual mouse (B, F-G) or GC (D, E). Statistical analysis was performed by two-way ANOVA, with a follow-up Sidak multiple-comparison test (H) or unpaired, nonparametric Mann-Whitney Student’s t-test. *, P < 0.05; **, P < 0.01; ***, P < 0.001; ****, P < 0.0001.

