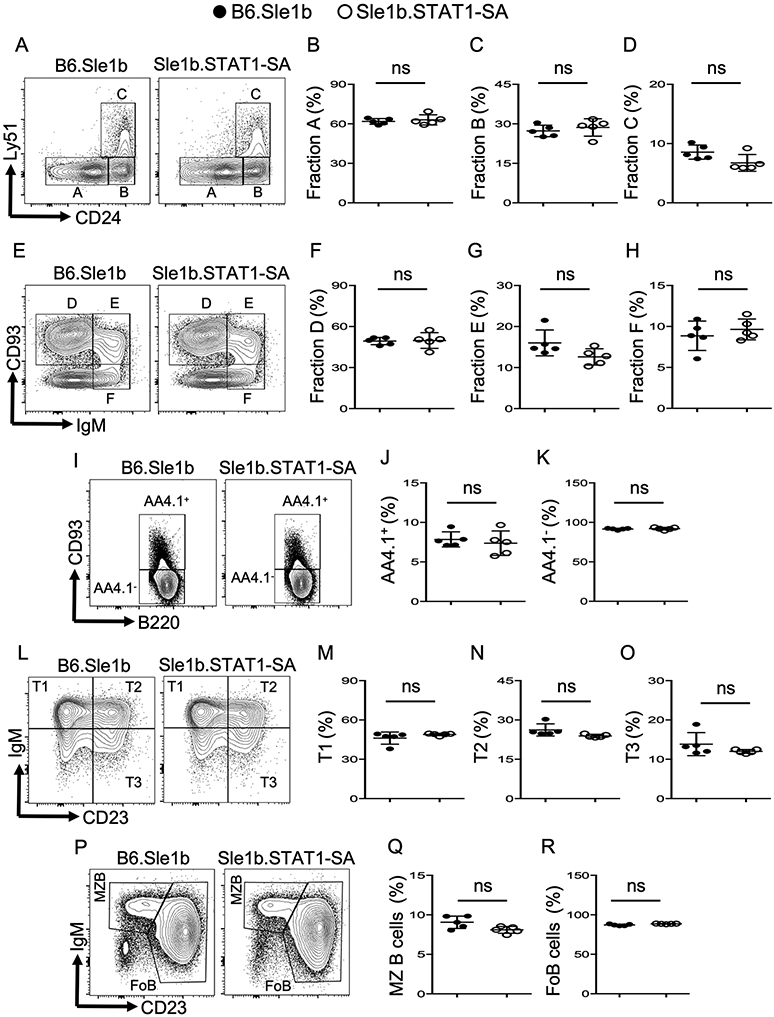
Figure 2. Mice expressing STAT1-SA mutant have normal B cell development.
Flow cytometry analysis showing gating strategies (A, E, I, L, P) and percentages of B cell developmental fraction A (B220+CD43+HSA−BP-1−) (A, B), fraction B (B220+CD43+HSA+BP-1−) (A, C), fraction C (B220+CD43+HSA+BP-1+) (A, D), fraction D (B220+CD43−IgM−CD93+) (E, F), fraction E (B220+CD43−IgM+CD93+) (E, G), and fraction F (B220+CD43−IgM+CD93−) (E, H) of live cell gated BM cells from B6.Sle1b and Sle1b.STAT1-SA mice. Splenocytes from the same mice were characterized for peripheral B cell developmental stages in spleens including AA4.1+ (I, J), AA4.1- (I, K), transitional type 1- T1 (B220+AA4.1+CD23−IgM+) (L, M), T2 (B220+AA4.1+CD23+IgM+) (L, N), and T3 (B220+AA4.1+CD23+IgM−) (L, O), marginal zone (MZ) B cells (B220+CD93−CD23−IgM+) (P, Q) and mature/follicular B cells (FoB) (B220+CD93−CD23+IgM+) (P, R) of total B220+ B cells. These data are representative of two independent experiments (4-5 mice in each experiment). Each symbol in each panel represents a mouse. Statistical analysis was performed by unpaired, nonparametric Mann-Whitney Student’s t-test. ns, non-significant.

