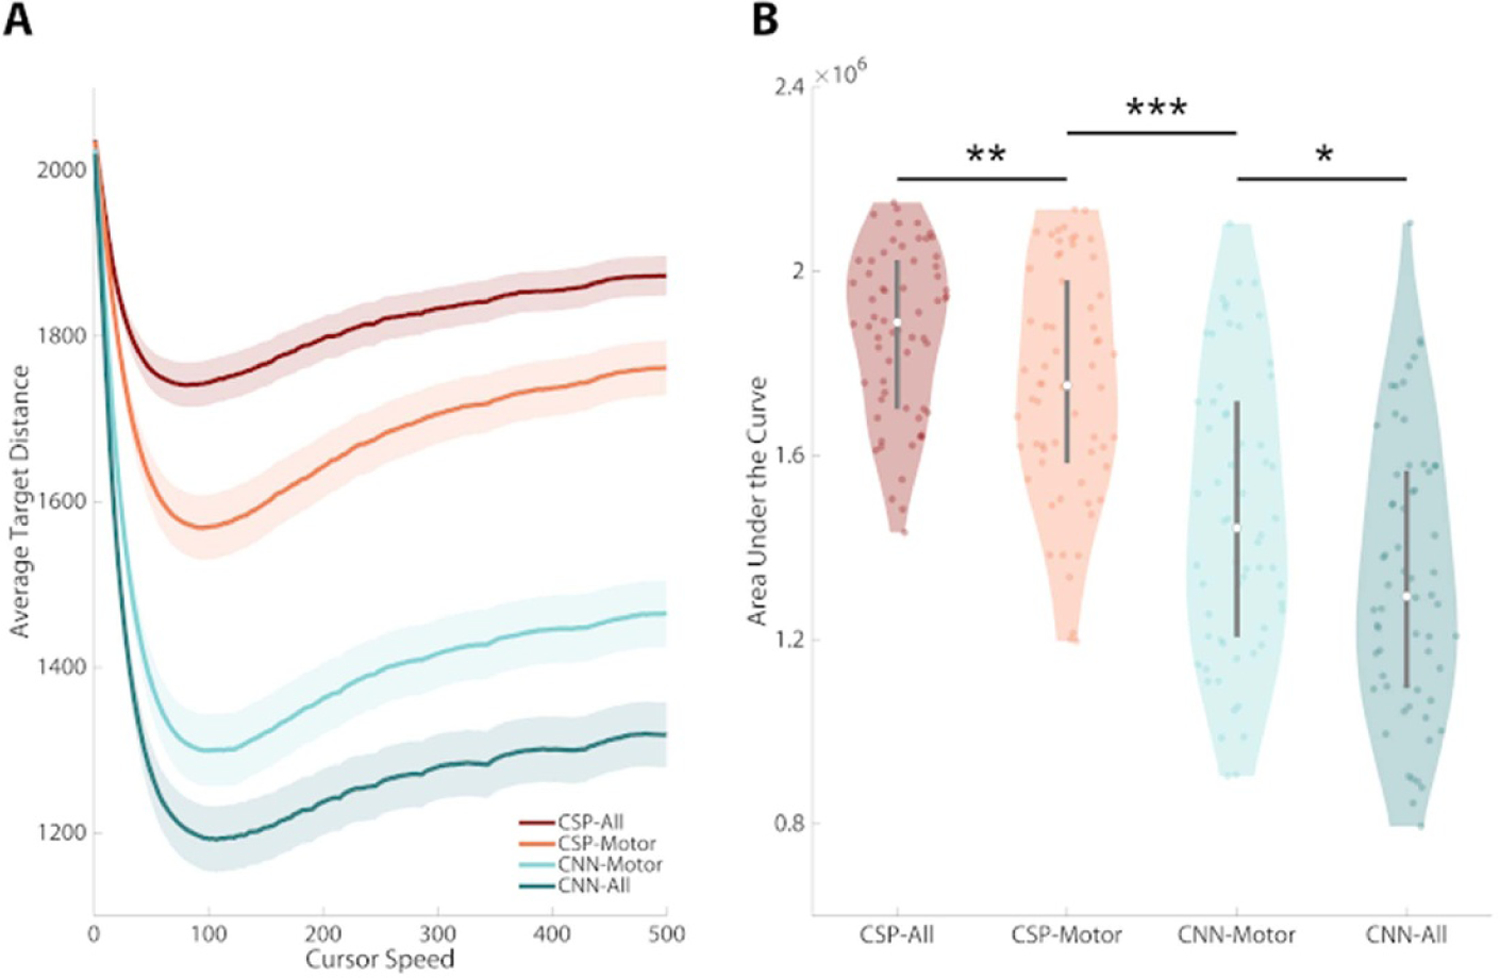
Figure 3.

Deep learning models lead to smaller distances to intended targets. Using a sliding window approach, the output of classification models (the predicted probability of class membership) can be used as a control signal for continuous BCI. (A) A receiver operating characteristic curve was made by varying the cursor speed (the gain parameter multiplying the model classification output) to measure how the different models perform in a continuous control environment. The y-axis can be thought of as model error, that is the average distance to the intended target. (B) When comparing the area under these curves, a Wald test rejected the null hypothesis that model type had no effect on rank (Wald, P < 0.00001). Significant reductions in average target distance were observed for each successive model type. CSP-All vs CSP-Motor (WRS, P = 0.01), CSP-Motor vs CNN-Motor (WRS, P < 0.00001), CNN-All vs CNN-Motor (WRS, P = 0.02). Line plots (A): shaded area represents ±1 standard error of the mean (S.E.M). Violin plots (B): shaded area represents kernel density estimate of the data, white circles represent the median, and grey bars represent the interquartile range.
