
Figure 6.
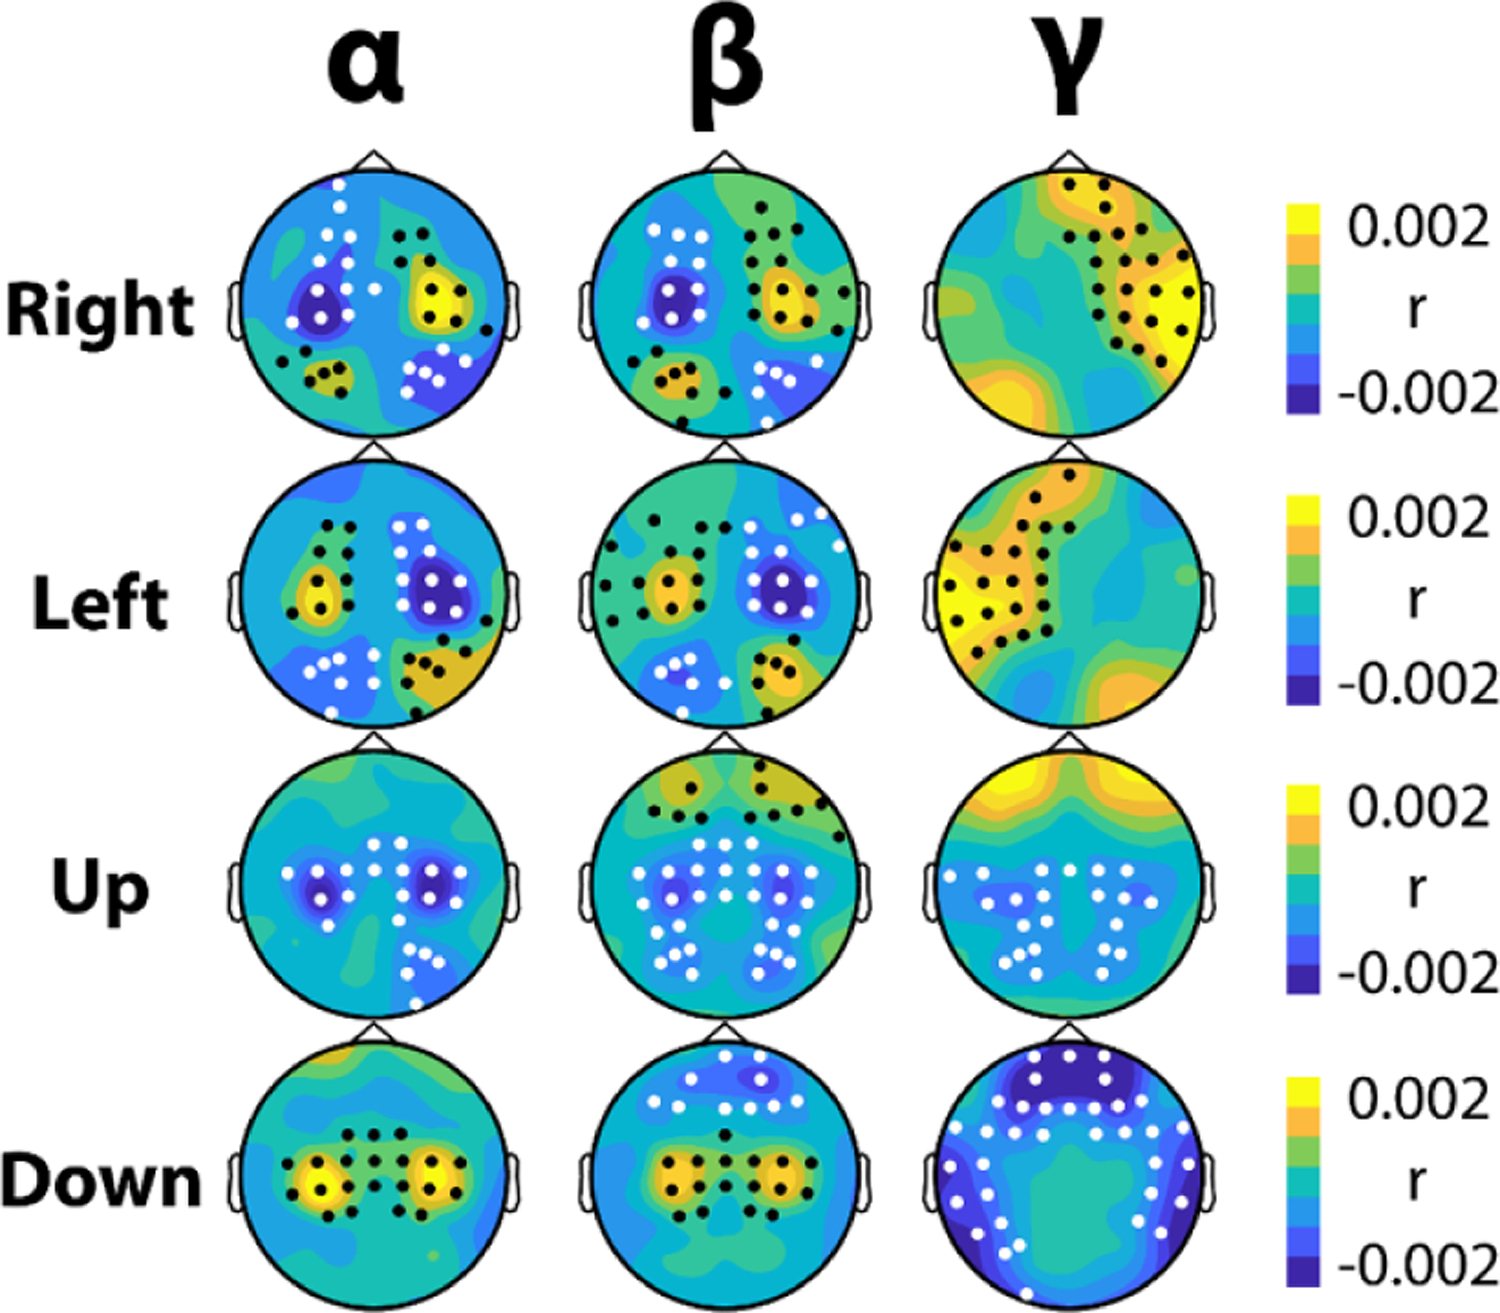
Feature importance maps display multiple biomarkers used in continuous BCI control. Using the input-perturbation network-prediction correlation method, feature importance maps were created for each motor imagery strategy. Warm colors occur when increases in power over these areas increase the classification accuracy, while cool colors occur when decreases in power increase the classification accuracy (or vice-versa). The value of r is the average correlation between changes in frequency power and changes in predicted class membership across subjects (e.g. when alpha power decreases over left motor cortex, models predict a higher probability of that data belonging to a right trial; when alpha power increases over right motor cortex the models also produce a higher probability of that data belonging to a right trial). Black dots represent significant clusters of positive correlation and white dots represent significant clusters of negative correlation. All clusters had a significance level lower than the Bonferroni threshold for multiple comparisons (P < 0.0042).