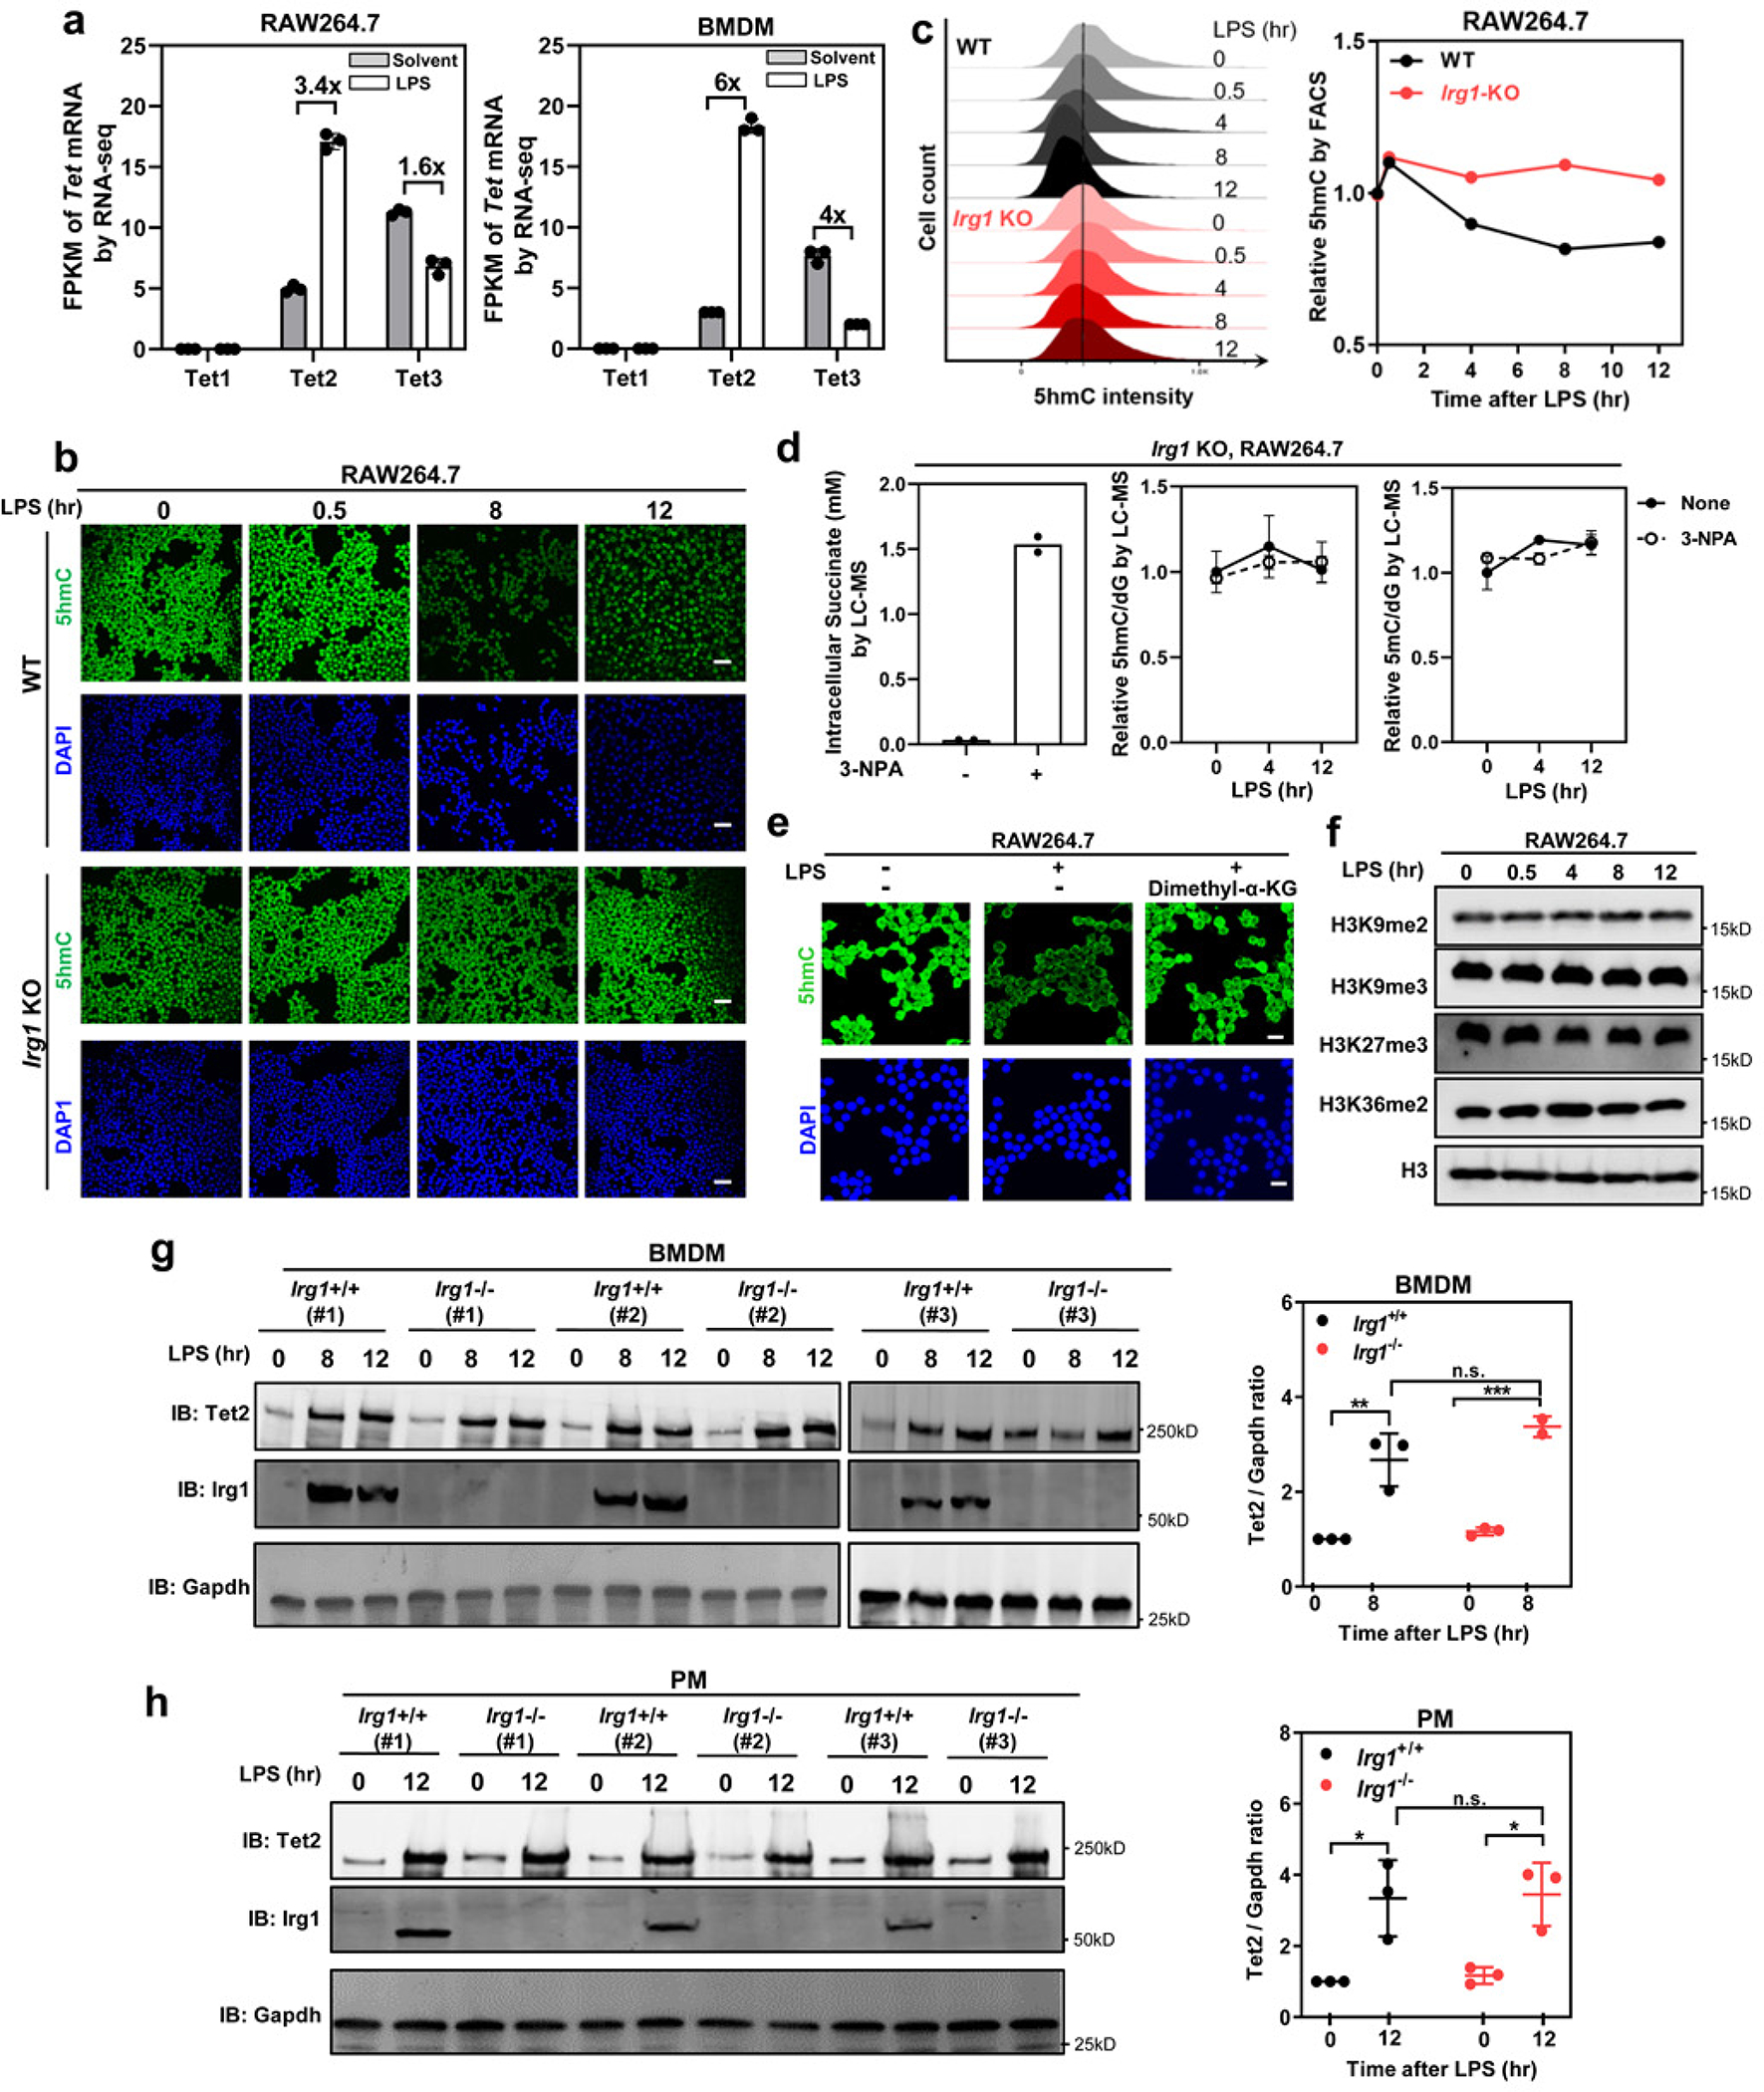
Extended Data Fig. 5. LPS-induced Itaconate inhibits Tet activity in macrophages.

a, In RAW264.7 and mouse BMDMs, relative mRNA expression of Tet1, Tet2 and Tet3 was determined by RNA-seq and plotted according to the fragments per kilobase of transcript per million mapped reads (FPKM) values. Fold changes in Tet gene expression for the indicated comparison are shown. Data shown are average values with S.D. of 3 independent experiments.
b, c, LPS treatment reduces genome-wide 5hmC in Irg1-WT but not Irg1-KO RAW264.7 cells. 5hmC was determined by IF staining (b) and FACS (c) in cells after LPS treatment for indicated time. Scale bar, 50 μm. Data shown in (c, right) are average values of 2 independent experiments.
d, LPS-triggered 5hmC decline is not due to succinate accumulation in macrophages. Irg1-KO RAW264.7 cells were treated with 3-NPA (1 mM), which specifically inhibits SDH and causes intracellular accumulation of succinate (left panel, data shown are average values with 2 independent experiments). Genomic levels of 5mC and 5hmC were determined by LC-MS/MS in these cells after LPS treatment for indicated time (middle and right panels, data shown are average values with S.D. of 3 independent experiments).
e, α-KG restores LPS-induced 5hmC decrease in RAW264.7 cells. Macrophages were challenged with LPS for 12 hours and then treated dimethyl-α-KG (1 mM) for 12 hours. Genomic 5hmC was detected by IF staining. Scale bar, 25 μm.
f, RAW264.7 cells were treated with LPS for indicated time, and then histone methylation markers were determined by western blot using indicated antibodies.
g, h, Mouse BMDMs (g) and thioglycolate elicited peritoneal macrophages (h) were from Irg1+/+ or Irg1−/− mice (n=3 mice per group), and then were either unstimulated or treated with LPS for indicated time. The levels of Tet2 and Irg1 proteins were determined by western blot using indicated antibodies.
P values are calculated using one-way ANOVA (g, h) for multiple comparisons. *denotes p < 0.05, **denotes p < 0.01, and ***denotes p < 0.001 for the indicated comparison. n.s. = not significant. Data represent two independent experiments with similar results in (b, e, f)
