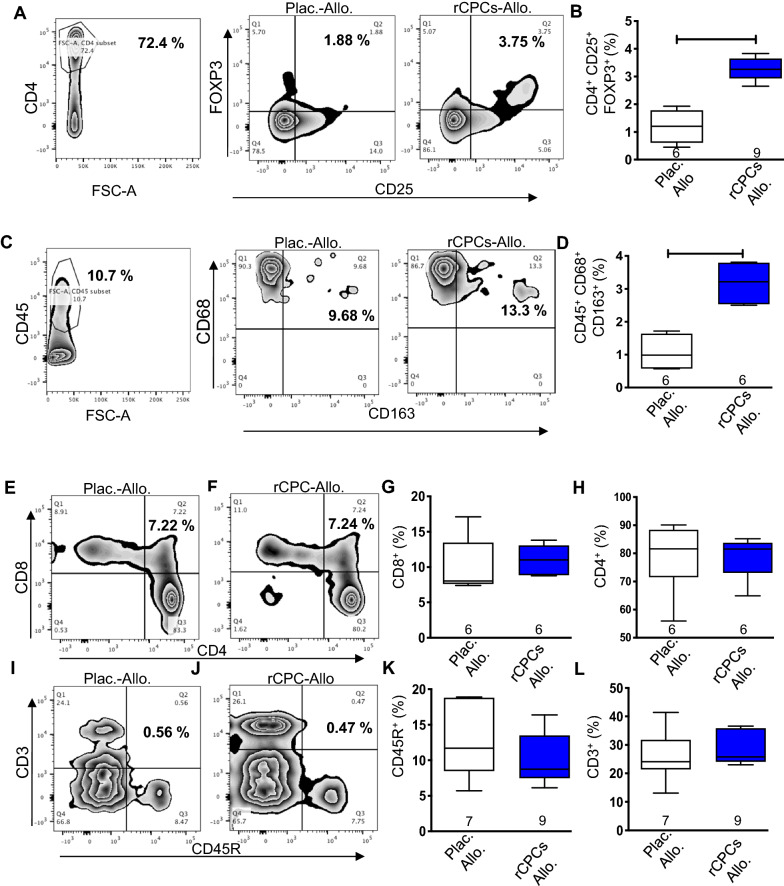
Fig. 2.
Immunomodulatory effects of rCPCs in vivo. For the in vivo study, one million rCPCs prepared from Wister Kyoto (WK) rat heats were injected intramyocardially immediately after myocardial infarctionin BN rats. Immune cells were isolated five days later. Flow images for detection of T-regs (A) and quantification (B). Flow images for M2 detection (C) and quantification (D). E–H show the percentage of CD8+ and CD4+ cells, respectively. Similarly, I, J show flow images and K, L depict the quantification of CD45R+ and CD3+ respectively. Numerical data are summarized as box and whisker plots with a median value (black bar inside box), 25th and 75th percentiles (bottom and top of box, respectively), and minimum and maximum values (bottom and top whisker, respectively). The number (n) of rats in each group indicated near the (up/below/on) each respective box and whisker plot

